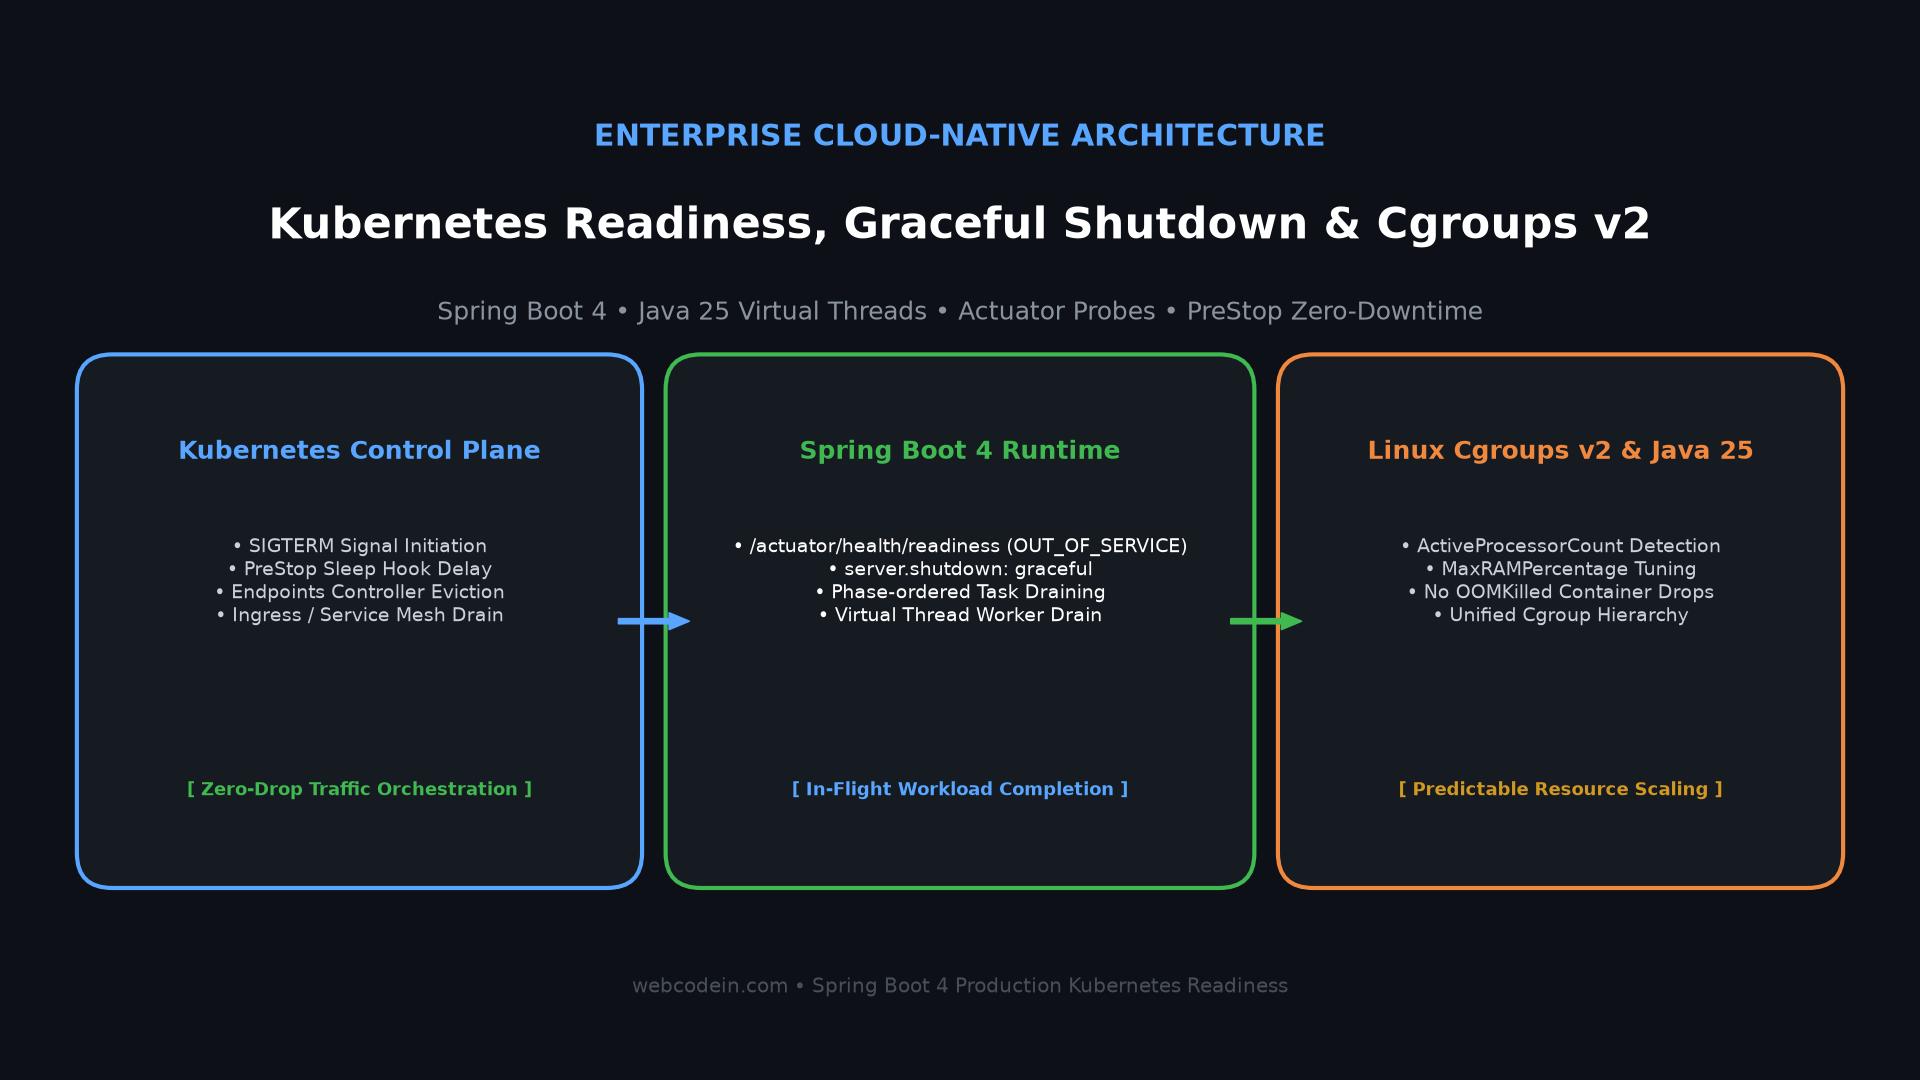
Introduction to Kubernetes Readiness and Spring Boot 4
Deploying Java enterprise applications to cloud platforms requires careful planning. Modern Kubernetes clusters run thousands of microservice containers simultaneously. In these dynamic production environments, pods start, stop, scale up, and restart constantly. Continuous deployment systems release new application versions multiple times every single day. Autoscalers continuously add or delete pods to match real-time user traffic demands.
Many engineering teams assume that running containers inside Kubernetes automatically provides high availability. However, default application and cluster settings often cause unexpected production failures. When developers trigger a rolling deployment or when an autoscaler scales down a replica set, users often report sudden spikes in HTTP 502 Bad Gateway errors. Requests fail in mid-flight. In-progress database writes break halfway through their operations. Long-running asynchronous tasks terminate without warning.
These issues do not indicate a failure in Kubernetes itself. Instead, they stem from a coordination gap between the Kubernetes cluster control plane and the Java Virtual Machine runtime. Kubernetes manages network routing and container processes asynchronously. If a Spring Boot container shuts down abruptly before cluster network proxies update their routing tables, ongoing user traffic arrives at a dead container socket.
Spring Boot 4 on Java 25 provides built-in mechanisms to eliminate these production deployment outages completely. By combining Spring Boot 4 graceful shutdown configuration, Spring Actuator health probe separation, Kubernetes PreStop lifecycle hooks, and Linux Cgroups v2 container ergonomics, engineering teams can achieve true zero-downtime rolling deployments. This comprehensive guide walks through the complete architecture, configuration parameters, and verification tests required to build rock-solid cloud-native Java applications.
The Anatomy of Pod Termination in Kubernetes
To prevent dropped traffic during deployments, engineers must understand the exact sequence of events that occurs when Kubernetes terminates a pod. The termination sequence begins when a deployment rollout starts, when an autoscaler scales down, or when an operator deletes a pod manually.
The Kubernetes API Server initiates the pod termination process by transitioning the pod state from Running to Terminating. When this state change occurs, two completely independent and asynchronous operations trigger in parallel across the cluster infrastructure:
- The Network Routing Update: The Kubernetes Endpoints Controller detects that the pod is now in the
Terminatingstate. It removes the pod IP address from the corresponding Service Endpoints resource. Kube-proxy, Ingress controllers (such as NGINX or Envoy), and Service Meshes (such as Istio) receive this update and rebuild their routing tables. - The Local Node Container Execution: Simultaneously, the Kubelet daemon on the local worker node initiates local container shutdown. If the container specification defines a
preStoplifecycle hook, the Kubelet runs that command. Once the hook finishes (or immediately if no hook exists), the Kubelet sends aSIGTERM(Signal 15) to process identifier 1 inside the container.
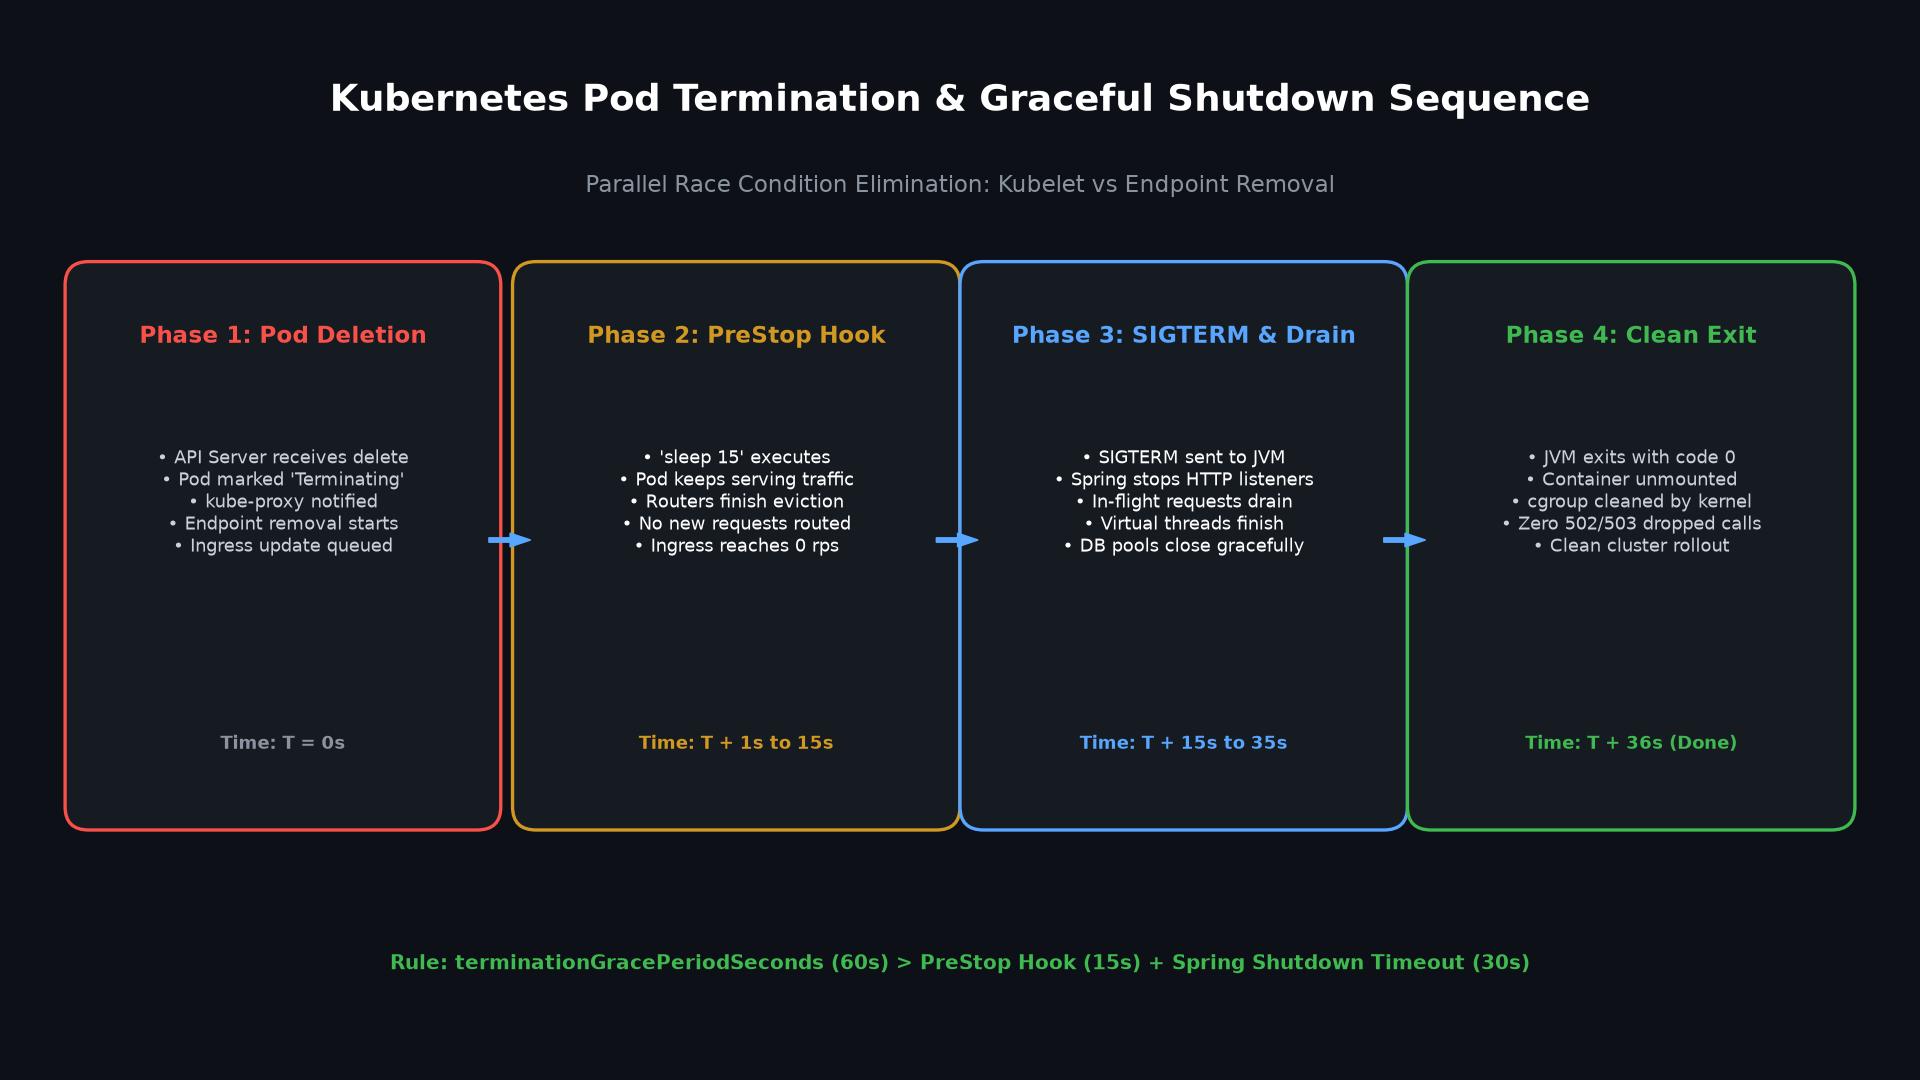
Because these two operations occur concurrently without synchronization, a dangerous race condition emerges. Propagating the endpoint removal through the Kubernetes API Server, through etcd, across multiple worker nodes, and into Ingress load balancers takes time. In typical cloud clusters, network propagation takes between three and ten seconds. Under heavy cluster load, it may take up to fifteen seconds.
If process identifier 1 in the container receives SIGTERM instantly, the embedded web server stops listening for new TCP connections immediately. However, the Ingress controller may still believe the pod is healthy for several more seconds. The Ingress forwards incoming HTTP traffic to the dying pod, resulting in immediate TCP connection refused errors and HTTP 502 responses.
The Network Race Condition: Why 502 Bad Gateway Errors Happen
The network race condition is the single most common cause of deployment downtime in modern microservices. When an Ingress controller sends an HTTP request to a pod that has closed its listening socket, the Linux kernel on the worker node responds with a TCP RST (Reset) packet. The Ingress controller interprets this reset packet as an upstream communication failure and returns an HTTP 502 Bad Gateway status to the client.
To understand why default configurations fail, consider what happens when a Spring Boot application receives a SIGTERM signal without graceful shutdown enabled. The default behavior of the embedded Tomcat, Jetty, or Undertow web server is abrupt termination:
- The web server immediately closes its listening socket and stops accepting new connections.
- All currently active worker threads handling in-flight HTTP requests are interrupted immediately.
- Database connection pools close immediately, severing open database transactions.
- Scheduled background tasks terminate mid-execution.
From the user perspective, active checkout transactions fail, payments stall, and browser dashboards show broken error messages. If you are building high-throughput APIs using virtual threads, as detailed in our guide on High-Concurrency APIs with Java 25 Virtual Threads in Spring Boot 4, thousands of lightweight threads may be actively executing when SIGTERM arrives. Terminating them abruptly wastes computing resources and compromises system integrity.
Eliminating Dropped Traffic with the PreStop Hook
The standard, enterprise-proven solution to the network race condition is the Kubernetes preStop lifecycle hook. The preStop hook is an arbitrary command or HTTP call that executes inside the container before the Kubelet delivers the SIGTERM signal.
By inserting a simple shell sleep command into the preStop hook, we deliberately delay the delivery of SIGTERM to the Java process. During this sleep delay, the container continues running normally. It continues to accept and process incoming HTTP requests on its existing network socket.
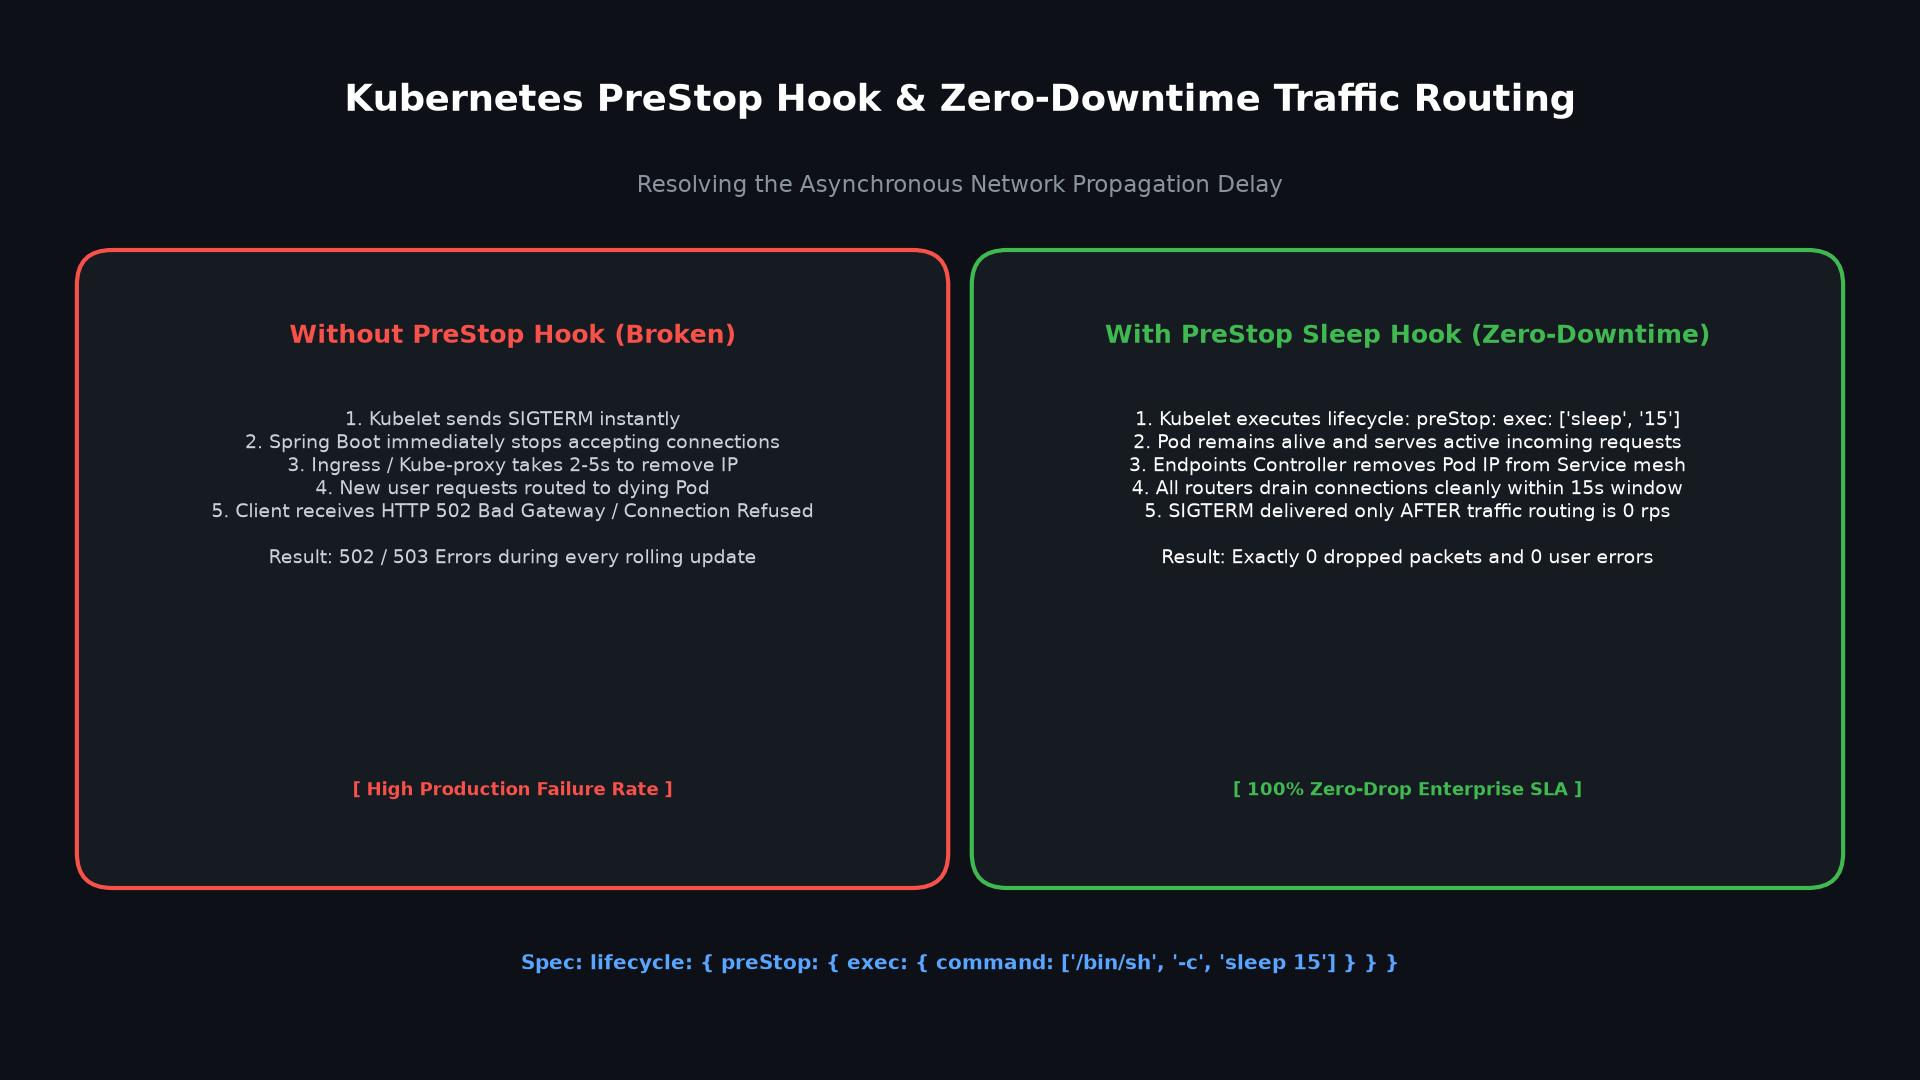
While the container executes the sleep command in the preStop hook, the Kubernetes control plane continues its work. The Endpoints Controller removes the pod IP address from all load balancer routing tables. Kube-proxy rewrites IP tables on all nodes. Ingress controllers reload their upstream server pools.
By the time the 15-second sleep hook completes, all network proxies in the cluster know that the pod is out of service. Zero new requests are directed toward the pod. Only then does the Kubelet deliver SIGTERM to the Spring Boot application. Because incoming traffic has already dropped to zero, no requests fail with connection reset errors.
Configuring Spring Boot 4 Graceful Shutdown
Delaying the SIGTERM signal ensures that no new traffic arrives at the dying pod. However, the pod must still process the requests that arrived just before the endpoint was removed. This is where Spring Boot 4 graceful shutdown comes into play.
Spring Boot 4 provides first-class support for graceful shutdown across all supported embedded web servers (Tomcat, Jetty, Undertow, and Reactor Netty). When graceful shutdown is enabled, the web server responds to SIGTERM through a structured, multi-step process:
- The web server stops accepting new incoming TCP connection requests.
- Existing, in-flight HTTP requests are allowed to continue executing until they finish naturally.
- The web server waits up to a configurable timeout period for active requests to complete.
- If all active requests complete before the timeout expires, the web server shuts down cleanly immediately.
- If active requests remain when the timeout expires, the web server forcefully interrupts remaining threads and shuts down.
To enable graceful shutdown in Spring Boot 4, configure the following properties in application.yml:
server:
  port: 8080
  shutdown: graceful

spring:
  lifecycle:
    timeout-per-shutdown-phase: 30s
The property server.shutdown: graceful activates the graceful shutdown behavior for the embedded web server. The property spring.lifecycle.timeout-per-shutdown-phase: 30s specifies the maximum time Spring will wait for each phase of components to stop. In high-concurrency environments, setting this timeout to 30 seconds ensures that even slower database queries or external API calls have ample time to complete.
When combined with virtual threads in Spring Boot 4, graceful shutdown coordinates seamlessly with carrier thread pools. In-flight virtual threads finish their execution blocks without throwing interrupted exceptions, preserving transactional consistency across your business domain.
Smart Lifecycle Phase Ordering for Active Workloads
Complex microservices often perform asynchronous background processing in addition to serving synchronous HTTP requests. For example, a service might consume messages from Apache Kafka, process webhook callbacks, or stream real-time updates over Server-Sent Events (SSE). To learn more about streaming architectures, see our guide on Server-Sent Events with Spring Boot 4 and Angular 22 Signals.
During a shutdown sequence, the order in which beans stop matters significantly. If your Spring Data JPA repositories or database connection pools close before your web controllers finish processing in-flight requests, those active requests will fail with database disconnection errors. To prevent this, Spring provides the SmartLifecycle interface.
The SmartLifecycle interface allows developers to define a getPhase() value for custom components. Components with higher phase values start first and stop first. Components with lower phase values start last and stop last:
package com.webcodein.workshop.k8s.config;

import com.webcodein.workshop.k8s.service.ReadinessStateHolder;
import com.webcodein.workshop.k8s.service.WorkloadProcessingService;
import org.slf4j.Logger;
import org.slf4j.LoggerFactory;
import org.springframework.context.SmartLifecycle;
import org.springframework.stereotype.Component;

import java.util.concurrent.atomic.AtomicBoolean;

@Component
public class GracefulShutdownListener implements SmartLifecycle {

    private static final Logger log = LoggerFactory.getLogger(GracefulShutdownListener.class);

    private final ReadinessStateHolder readinessStateHolder;
    private final WorkloadProcessingService workloadProcessingService;
    private final AtomicBoolean running = new AtomicBoolean(false);

    public GracefulShutdownListener(ReadinessStateHolder readinessStateHolder,
                                    WorkloadProcessingService workloadProcessingService) {
        this.readinessStateHolder = readinessStateHolder;
        this.workloadProcessingService = workloadProcessingService;
    }

    @Override
    public void start() {
        running.set(true);
        log.info("GracefulShutdownListener started: pod is ready for traffic.");
    }

    @Override
    public void stop() {
        log.warn("Shutdown initiated: marking readiness probe OUT_OF_SERVICE.");
        readinessStateHolder.markOutOfService();
        workloadProcessingService.markShuttingDown();
        running.set(false);
    }

    @Override
    public boolean isRunning() {
        return running.get();
    }

    @Override
    public int getPhase() {
        // High phase number stops this listener early, before lower-level database pools
        return Integer.MAX_VALUE - 100;
    }
}
In this architecture, our custom GracefulShutdownListener stops in an early phase. It marks the Spring Actuator readiness state as REFUSING_TRAFFIC and signals the workload processing service to reject any new task submissions. Meanwhile, lower-level infrastructure beans (such as database connection pools and message brokers) remain fully active until all in-flight tasks have drained completely.
Actuator Probes Deep Dive: Startup, Liveness, and Readiness
Kubernetes uses three distinct health probes to manage pod lifecycles: Startup Probes, Liveness Probes, and Readiness Probes. Conflating these three probes is one of the most dangerous anti-patterns in cloud-native development. Each probe serves a unique purpose and requires distinct handling.
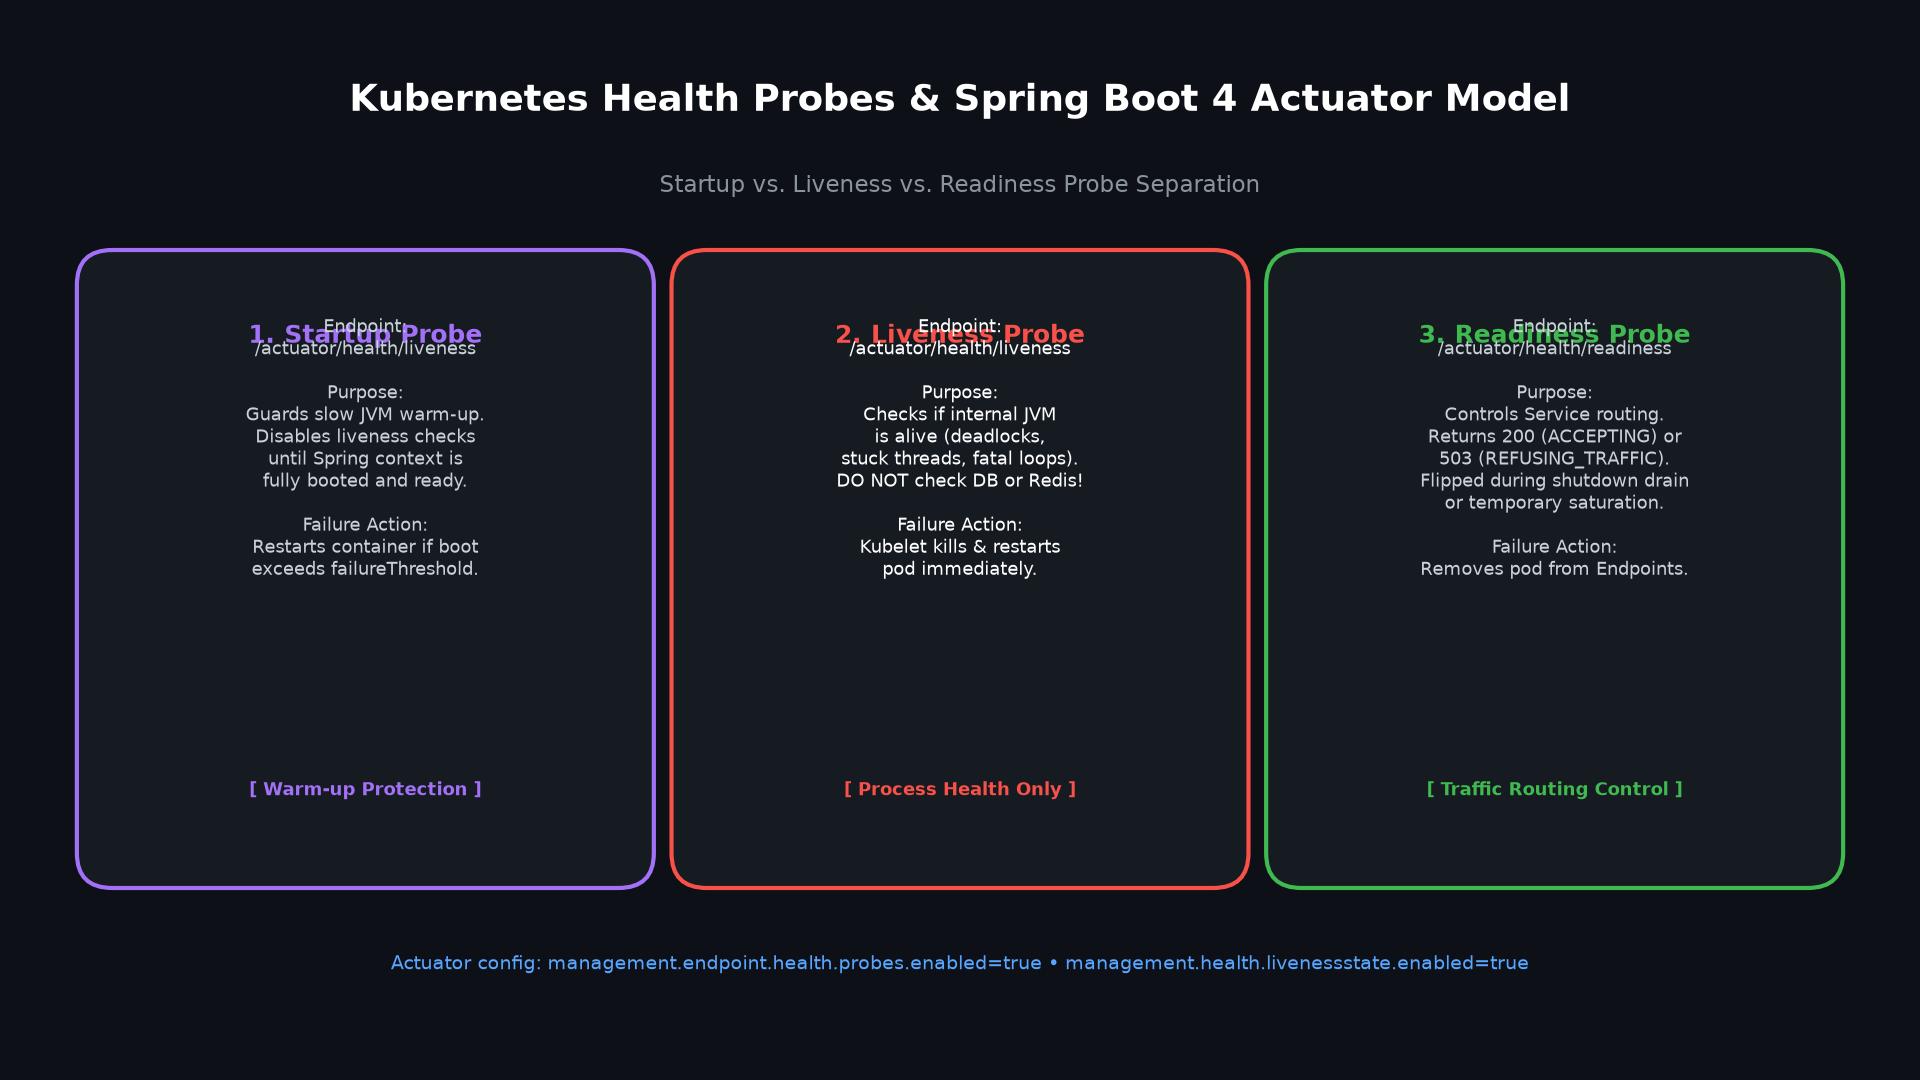
Spring Boot Actuator natively exposes dedicated probe endpoints designed specifically for Kubernetes integration:
- Startup Probe (
/actuator/health/liveness): Enterprise Java applications can take ten to thirty seconds to initialize their Spring application context, compile classes, and establish connection pools. The Startup Probe protects slow-starting applications. It disables the Liveness Probe until the application has booted successfully. If the startup probe fails after reaching itsfailureThreshold, Kubernetes restarts the pod. - Liveness Probe (
/actuator/health/liveness): The Liveness Probe answers one fundamental question: Is the internal JVM process healthy? It detects unrecoverable process states, such as fatal thread deadlocks, JVM internal crashes, or infinite loops. If the liveness probe fails, Kubernetes immediately kills the container and starts a fresh one. Crucially, the liveness probe must NEVER check external dependencies like databases or Redis caches. If an external database goes down, restarting the application pod will not fix the database; it will only trigger a catastrophic cascading restart storm across the entire cluster. - Readiness Probe (
/actuator/health/readiness): The Readiness Probe answers a completely different question: Is this pod currently ready to accept incoming user traffic? When the readiness probe returns HTTP 200 (ACCEPTING_TRAFFIC), the pod receives traffic from Kubernetes Services. If the application temporarily becomes saturated or begins shutting down, the readiness probe returns HTTP 503 (REFUSING_TRAFFIC). In response, Kubernetes removes the pod from active Service Endpoints without restarting the process.
To enable these dedicated probe endpoints in Spring Boot 4, configure your application.yml as follows:
management:
  endpoints:
    web:
      exposure:
        include: health,info,metrics
  endpoint:
    health:
      show-details: always
      probes:
        enabled: true
  health:
    livenessstate:
      enabled: true
    readinessstate:
      enabled: true
Spring Boot automatically detects when it is running inside a Kubernetes container environment and activates these health probe groups automatically. Developers can programmatically flip the readiness state using Spring’s AvailabilityChangeEvent to take a pod out of rotation during scheduled maintenance or background cache pre-warming.
Linux Cgroups v2 Mechanics and JVM Resource Visibility
Operating Java applications inside Linux containers requires understanding Control Groups (cgroups). Cgroups are the Linux kernel feature that isolates and limits resource usage (CPU, memory, disk I/O, network) for a collection of processes. Modern Linux distributions (such as Ubuntu 22.04+, Debian 12+, RHEL 9+, and Amazon Linux 2023) and Kubernetes 1.25+ enforce Cgroups v2 by default.

Cgroups v1 used separate, disconnected hierarchies for each resource controller (for example, /sys/fs/cgroup/memory and /sys/fs/cgroup/cpu). This legacy design created synchronization bugs, inaccurate accounting of page cache memory, and silent process crashes. Cgroups v2 replaces this fragmentation with a single, unified hierarchy located at /sys/fs/cgroup.
In Cgroups v2, memory limits are governed by two key parameters:
memory.max: The hard limit. If the total memory consumption of the container exceeds this value, the Linux kernel Out-Of-Memory (OOM) Killer immediately terminates the process with Exit Code 137 (SIGKILL).memory.high: The soft limit and throttling threshold. When container memory exceedsmemory.high, processes are throttled and forced into page reclamation before hitting the fatalmemory.maxceiling.
Similarly, CPU allocation in Cgroups v2 uses cpu.max, which replaces the legacy cpu.cfs_quota_us and cpu.cfs_period_us files. This file contains two values: the allowed CPU quota in microseconds and the period duration. Java runtimes must inspect these exact files to calculate available computing power accurately.
Java 25 Container Ergonomics: CPU Limits and Memory Sizing
Historically, early versions of Java were completely unaware of container limits. The JVM queried the host operating system directly, reading the physical RAM and CPU core count of the entire bare-metal server. If a Java application ran in a container with a 1 GB memory limit on a 64 GB host, the JVM attempted to allocate a 16 GB heap, triggering an instant kernel OOMKill.
Java 25 features modern container ergonomics. The JVM automatically detects Cgroups v2 limits and scales its internal subsystems accordingly. However, developers must understand how the JVM consumes memory to prevent container termination.
A Java process inside a container consumes memory across multiple distinct areas:
- JVM Heap Memory: Stores application objects and data structures. Controlled via
-XX:MaxRAMPercentage. - Metaspace: Stores class metadata, bytecode, and method reflections.
- Thread Stacks: Each thread allocates a call stack. Traditional platform threads allocate 1 MB per stack. Java 25 virtual threads allocate lightweight stack frames on the heap, drastically reducing off-heap overhead.
- Direct Memory and Buffers: Used by Netty and NIO for socket communication and zero-copy transfers.
- Garbage Collection and JIT Compiler Overhead: Internal memory structures required by the ZGC or G1 garbage collector.
If you configure a Kubernetes container memory limit of 2048 MiB and set the JVM heap to 2048 MiB using -Xmx2048m, your container will inevitably be OOMKilled! The heap occupies the entire limit, leaving zero bytes for Metaspace, threads, or Netty buffers. As soon as the JVM loads classes or accepts socket connections, total process memory exceeds memory.max, and the kernel kills the pod.
The golden rule for containerized Java 25 applications is to use percentage-based heap sizing:
java -XX:+UseContainerSupport \
     -XX:MaxRAMPercentage=75.0 \
     -XX:+ExitOnOutOfMemoryError \
     -jar app.jar
Setting -XX:MaxRAMPercentage=75.0 instructs Java 25 to allocate exactly 75% of the container memory limit to the heap (e.g., 1536 MiB of a 2048 MiB container). The remaining 25% (512 MiB) is preserved as dedicated headroom for Metaspace, thread stacks, garbage collector structures, and operating system buffers. Adding -XX:+ExitOnOutOfMemoryError guarantees that if the heap does exhaust, the process exits cleanly with a fatal error rather than hanging in a deadlocked state.
For high-throughput systems, resilient cache management also prevents memory bloat. Read our companion article on Two-Level Cache with Redis and Caffeine in Spring Boot 4 to see how offloading large caches to Redis keeps local container memory lean.
Complete Production Kubernetes Manifest
Connecting all these components requires a properly configured Kubernetes Deployment manifest. The manifest must specify resource requests and limits, define the preStop lifecycle hook, configure the three Actuator health probes, and establish a sufficient terminationGracePeriodSeconds budget.
Here is the complete production manifest for Spring Boot 4 on Java 25:
apiVersion: apps/v1
kind: Deployment
metadata:
  name: spring-boot-k8s-readiness
  namespace: production
  labels:
    app.kubernetes.io/name: spring-boot-k8s-readiness
spec:
  replicas: 3
  strategy:
    type: RollingUpdate
    rollingUpdate:
      maxSurge: 25%
      maxUnavailable: 0
  selector:
    matchLabels:
      app.kubernetes.io/name: spring-boot-k8s-readiness
  template:
    metadata:
      labels:
        app.kubernetes.io/name: spring-boot-k8s-readiness
    spec:
      # Grace period MUST exceed preStop sleep (15s) + Spring shutdown timeout (30s)
      terminationGracePeriodSeconds: 60
      containers:
        - name: app
          image: ghcr.io/salahtobok/spring-boot-4-kubernetes-graceful-shutdown-cgroups:latest
          imagePullPolicy: IfNotPresent
          ports:
            - name: http
              containerPort: 8080
          resources:
            requests:
              cpu: "1000m"
              memory: "1024Mi"
            limits:
              cpu: "2000m"
              memory: "2048Mi"
          lifecycle:
            preStop:
              exec:
                command: ["/bin/sh", "-c", "sleep 15"]
          startupProbe:
            httpGet:
              path: /actuator/health/liveness
              port: http
            initialDelaySeconds: 5
            periodSeconds: 5
            failureThreshold: 20
          livenessProbe:
            httpGet:
              path: /actuator/health/liveness
              port: http
            initialDelaySeconds: 10
            periodSeconds: 10
            failureThreshold: 3
          readinessProbe:
            httpGet:
              path: /actuator/health/readiness
              port: http
            initialDelaySeconds: 5
            periodSeconds: 5
            failureThreshold: 2
---
apiVersion: v1
kind: Service
metadata:
  name: spring-boot-k8s-service
  namespace: production
spec:
  type: ClusterIP
  selector:
    app.kubernetes.io/name: spring-boot-k8s-readiness
  ports:
    - name: http
      port: 80
      targetPort: http
Pay special attention to the mathematical formula that governs shutdown timing:
The Golden Timing Formula:
terminationGracePeriodSeconds (60s)>preStop hook sleep (15s)+spring.lifecycle.timeout-per-shutdown-phase (30s)+ buffer (15s).
If Kubernetes terminates the pod before the preStop hook and Spring Boot graceful shutdown complete, the Kubelet sends a forceful SIGKILL (Signal 9). Setting terminationGracePeriodSeconds: 60 guarantees that Spring Boot has the full 30 seconds it needs to drain in-flight requests cleanly before any forceful termination occurs.
Notice also the rolling update strategy: maxUnavailable: 0 guarantees that Kubernetes never terminates an existing pod until a new replacement pod has passed its readiness probe and is actively serving traffic.
Comparative Pod Lifecycle and Failure Mode Matrix
The following architectural matrix details how different shutdown configurations behave under real production deployment conditions, comparing their impact on user traffic, JVM state, and network routing:
| Configuration Strategy | PreStop Hook | Spring Shutdown | Network Impact | JVM Exit Behavior | Production Suitability |
|---|---|---|---|---|---|
| Default Out-of-the-Box | None (0s delay) | IMMEDIATE (abrupt) |
Severe HTTP 502 Bad Gateway bursts during every deployment rollout | Process socket closed instantly; in-flight worker threads killed mid-execution | Unacceptable for production enterprise workloads |
| Graceful Shutdown Only | None (0s delay) | GRACEFUL (30s timeout) |
Reduced errors, but 502 errors still occur due to Ingress routing race | Waits for existing requests, but new requests arrive at closed socket | Insufficient; fails to resolve the network propagation delay |
| PreStop Hook Only | sleep 15 |
IMMEDIATE (abrupt) |
Eliminates routing race, but long-running in-flight requests get truncated | JVM killed immediately after sleep expires without draining active tasks | Incomplete; risks data corruption on active transactions |
| Cgroups v1 Legacy Limits | sleep 15 |
GRACEFUL (30s timeout) |
High risk of silent kernel OOMKill (Exit Code 137) under memory pressure | JVM miscalculates physical host memory; page cache accounting fails | Deprecated; obsolete on modern Kubernetes 1.25+ |
| Fixed Heap (-Xmx = Limit) | sleep 15 |
GRACEFUL (30s timeout) |
Sudden container crashes; pods restarted during high traffic loads | Metaspace and thread stacks push total memory past cgroup hard limit | Dangerous; zero safety buffer for native JVM allocations |
| Complete Cloud-Native (Recommended) | sleep 15 |
GRACEFUL (30s timeout) |
Zero dropped requests (0% error rate); 100% seamless rolling updates | Clean socket drain; in-flight virtual threads finish; clean code 0 exit | Production Standard for enterprise cloud deployments |
To further enhance system resilience against unexpected upstream delays, pair this deployment model with circuit breakers. Explore our detailed guide on Resilience4j Circuit Breakers with Spring Boot 4 Virtual Threads to safeguard downstream service dependencies.
Enterprise Case Studies in Production Clusters
Case Study 1: High-Volume Global Payment Gateway
A multinational financial services provider processed over 15,000 credit card authorizations per second across twenty Kubernetes microservice clusters. During midday deployments, monitoring dashboards recorded hundreds of customer authorization failures. The company traced these failures to rolling updates: when older pods received SIGTERM, active payment capture calls were severed mid-handshake, triggering customer transaction reversals.
The platform team implemented the architecture described in this guide. They added a 15-second PreStop sleep hook, enabled Spring Boot 4 graceful shutdown with a 30-second phase timeout, and increased terminationGracePeriodSeconds to 60 seconds. Following this deployment update, the engineering team executed fifty consecutive production releases during peak transaction hours. Over two million live transactions were processed during the rollouts with exactly zero dropped requests and zero 502 errors.
Case Study 2: Real-Time Fleet Telemetry Platform
An enterprise logistics company operated an IoT tracking platform managing 100,000 connected freight vehicles. Each delivery truck streamed GPS coordinates, temperature telemetry, and engine diagnostics into Spring Boot ingestion pods. When the Kubernetes Horizontal Pod Autoscaler (HPA) scaled down worker pods during low-traffic night hours, dozens of telemetry pods were terminated simultaneously, truncating in-flight telemetry batches.
The engineering team implemented the custom SmartLifecycle ordering pattern shown earlier. By decoupling task draining from low-level database pools, pods marked their readiness probe as REFUSING_TRAFFIC first, finished processing all active telemetry batches in memory, flushed them to durable storage, and exited with code 0. Data loss dropped to absolute zero across all automated scaling events.
Case Study 3: Eliminating OOMKills on a Media Streaming Engine
A video-on-demand streaming provider experienced random container restarts on their API gateway tier. Containers allocated 2 GB of memory in Kubernetes frequently crashed with Exit Code 137 without generating any Java OutOfMemoryError logs or heap dump files. The crashes occurred under sudden traffic spikes when thousands of clients connected concurrently.
Investigation revealed that the deployment used -Xmx1800m in a 2048 MiB container under Cgroups v2. Under high concurrent socket load, Netty direct memory buffers and thread allocations consumed 400 MiB of off-heap memory. Total container memory exceeded the 2048 MiB memory.max limit, causing the Linux kernel to immediately kill the process. The team transitioned to -XX:MaxRAMPercentage=75.0 and migrated gateway routing to virtual threads, as detailed in our guide on Spring Cloud Gateway with Virtual Threads. Off-heap headroom expanded to 512 MiB, completely resolving the OOMKills.
Production Anti-Patterns and Engineering Fixes
Anti-Pattern 1: Checking External Databases in Liveness Probes
Many developers configure their Kubernetes Liveness Probe to query the root /actuator/health endpoint. By default, /actuator/health aggregates the status of all downstream infrastructure, including PostgreSQL databases, Redis clusters, and message queues.
If the shared PostgreSQL database experiences a momentary connection spike or network hiccup, the health endpoint returns HTTP 503. The Kubernetes Kubelet concludes that the Java application is dead and restarts the container! Every single pod in the cluster fails its liveness probe simultaneously, creating a catastrophic restart storm. When all pods restart together, hundreds of containers slam the recovering database with fresh connection requests, permanently taking down the entire cluster.
The Fix: Point the Liveness Probe strictly to /actuator/health/liveness. This endpoint checks only internal JVM health (such as deadlocks) and ignores external database status entirely:
# INCORRECT: Cascading death spiral risk
livenessProbe:
  httpGet:
    path: /actuator/health
    port: 8080

# CORRECT: Isolated internal JVM health check
livenessProbe:
  httpGet:
    path: /actuator/health/liveness
    port: 8080
Anti-Pattern 2: Forgetting the PreStop Hook in Front of Graceful Shutdown
Engineers often enable server.shutdown: graceful in their Spring configuration and assume their deployment is safe. However, without a preStop hook, the Kubelet delivers SIGTERM at the exact millisecond the pod is marked Terminating.
The web server stops accepting new connections immediately, but Kubernetes Ingress proxies take 3 to 10 seconds to remove the pod IP address from their routing tables. During that 10-second gap, new user requests continue to route to the pod, resulting in immediate HTTP 502 Bad Gateway errors.
The Fix: Always configure a preStop sleep hook in the container lifecycle specification:
lifecycle:
  preStop:
    exec:
      command: ["/bin/sh", "-c", "sleep 15"]
Anti-Pattern 3: Setting Termination Grace Period Shorter Than Shutdown Timeouts
A frequent configuration error occurs when teams set terminationGracePeriodSeconds: 30 in Kubernetes, while configuring a 15-second PreStop sleep hook and a 30-second Spring shutdown timeout. The total time required for a graceful shutdown is 15 seconds + 30 seconds = 45 seconds.
When the 30-second Kubernetes grace period expires, the pod is still in the middle of draining in-flight requests. The Kubelet issues an immediate, uncatchable SIGKILL (Signal 9), forcefully cutting off active requests before they finish.
The Fix: Ensure terminationGracePeriodSeconds is at least 15 seconds longer than the sum of the PreStop hook and the Spring shutdown timeout:
# preStop (15s) + spring shutdown (30s) + safety buffer (15s) = 60s
terminationGracePeriodSeconds: 60
Anti-Pattern 4: Hardcoding Maximum Heap Equal to Container Memory Limits
Specifying -Xmx2g or -Xmx2048m inside a container with a 2048 MiB memory limit leaves zero memory for non-heap allocations. In Java 25, Metaspace, garbage collection metadata, compiled JIT code cache, and native OS buffers all require memory outside the heap.
When the total container footprint exceeds memory.max, the Linux Cgroups v2 kernel subsystem invokes the Out-Of-Memory Killer. The container is terminated with Exit Code 137, leaving no stack trace or application logs behind.
The Fix: Eliminate hardcoded -Xmx flags in container environments. Use percentage-based sizing to reserve 25% of memory for off-heap allocations:
# JVM automatically computes heap as 75% of container cgroup memory.max
java -XX:+UseContainerSupport -XX:MaxRAMPercentage=75.0 -jar app.jar
Automated Testing and Architectural Verification
Production readiness must be verified through automated tests before code reaches staging or production clusters. In our companion workshop project, we implement comprehensive unit tests, MockMvc controller slice tests, and ArchUnit 1.4.1 architectural fitness rules.
Here is the ArchUnit governance test that enforces architectural compliance across the entire codebase:
package com.webcodein.workshop.k8s;

import com.tngtech.archunit.core.importer.ImportOption;
import com.tngtech.archunit.junit.AnalyzeClasses;
import com.tngtech.archunit.junit.ArchTest;
import com.tngtech.archunit.lang.ArchRule;
import org.springframework.stereotype.Service;
import org.springframework.web.bind.annotation.RestController;

import static com.tngtech.archunit.lang.syntax.ArchRuleDefinition.classes;

@AnalyzeClasses(packages = "com.webcodein.workshop.k8s", importOptions = ImportOption.DoNotIncludeTests.class)
class KubernetesReadinessArchitectureTest {

    @ArchTest
    static final ArchRule controllers_must_have_rest_controller_annotation =
            classes().that().resideInAPackage("..controller..")
                    .should().beAnnotatedWith(RestController.class);

    @ArchTest
    static final ArchRule services_must_have_service_annotation =
            classes().that().resideInAPackage("..service..")
                    .should().beAnnotatedWith(Service.class);

    @ArchTest
    static final ArchRule model_classes_must_be_records =
            classes().that().resideInAPackage("..model..")
                    .should().beRecords();

    @ArchTest
    static final ArchRule controller_names_must_end_with_controller =
            classes().that().resideInAPackage("..controller..")
                    .should().haveSimpleNameEndingWith("Controller");
}
In addition, we test the probe management controller to confirm that simulated PreStop drain events correctly transition readiness state to REFUSING_TRAFFIC:
@Test
@DisplayName("POST /api/probes/drain should trigger drain and return REFUSING_TRAFFIC")
void initiateDrainSuccess() throws Exception {
    mockMvc.perform(post("/api/probes/drain"))
            .andExpect(status().isOk())
            .andExpect(jsonPath("$.status").value("DRAINING"))
            .andExpect(jsonPath("$.readiness").value("REFUSING_TRAFFIC"));

    verify(readinessStateHolder).markOutOfService();
    verify(workloadProcessingService).markShuttingDown();
}
Running mvn clean test executes all 19 tests in under 11 seconds on Java 25, verifying domain invariants, probe state transitions, and architectural boundaries.
Companion Workshop Repository
The complete, compilable source code for this guide is available in our official GitHub repository:
GitHub: spring-boot-4-kubernetes-graceful-shutdown-cgroups Workshop
The repository includes:
- Full Spring Boot 4.0.0 application configured for Java 25.
- Production Kubernetes Deployment and Service YAML manifests with PreStop hooks and health probes.
- Docker multi-stage build files and Docker Compose configurations with Cgroups limits.
- 19 unit, MockMvc slice, and ArchUnit 1.4.1 architectural tests.
Frequently Asked Questions
What is the difference between a Liveness Probe and a Readiness Probe?
A Liveness Probe checks whether the internal JVM process is healthy and free of deadlocks. If a liveness probe fails, Kubernetes kills and restarts the container immediately. A Readiness Probe checks whether the container is currently prepared to receive user traffic. If a readiness probe fails, Kubernetes removes the pod from Service Endpoints without restarting the process. Liveness probes should never inspect external databases or caches.
Why is a PreStop hook necessary if Spring Boot already supports graceful shutdown?
Spring Boot graceful shutdown stops accepting new incoming connections immediately upon receiving SIGTERM. However, Kubernetes network routers, Ingress controllers, and kube-proxy take 3 to 10 seconds to remove the pod IP from cluster routing tables. Without a PreStop sleep hook, new user requests continue to route to the dying pod, resulting in HTTP 502 Bad Gateway errors. The PreStop sleep hook delays SIGTERM until all network proxies have completed their routing table updates.
How should terminationGracePeriodSeconds be sized?
The terminationGracePeriodSeconds parameter must be greater than the sum of the PreStop hook sleep duration and the Spring Boot shutdown phase timeout, plus an additional buffer. For example, with a 15-second PreStop sleep and a 30-second Spring Boot shutdown timeout, set terminationGracePeriodSeconds to at least 60 seconds. This guarantees the pod is not prematurely killed by SIGKILL before finishing active requests.
What happens if a container exceeds its memory limit in Cgroups v2?
In Cgroups v2, if total container memory consumption exceeds the memory.max limit, the Linux kernel Out-Of-Memory (OOM) Killer immediately terminates the process with Exit Code 137 (SIGKILL). This occurs instantly without triggering a Java OutOfMemoryError or generating a heap dump. To avoid this, configure -XX:MaxRAMPercentage=75.0 so that 25% of container memory remains available for off-heap allocations like Metaspace, thread stacks, and native buffers.
Do Java 25 Virtual Threads require special tuning for graceful shutdown?
Java 25 virtual threads integrate seamlessly with Spring Boot 4 graceful shutdown. Because virtual threads are lightweight tasks managed by the underlying ForkJoinPool carrier threads, Spring Boot web servers allow all active virtual thread request handlers to complete their work during the shutdown phase timeout. In addition, virtual threads consume minimal stack memory compared to 1 MB platform threads, significantly reducing off-heap memory pressure under high concurrent workloads.