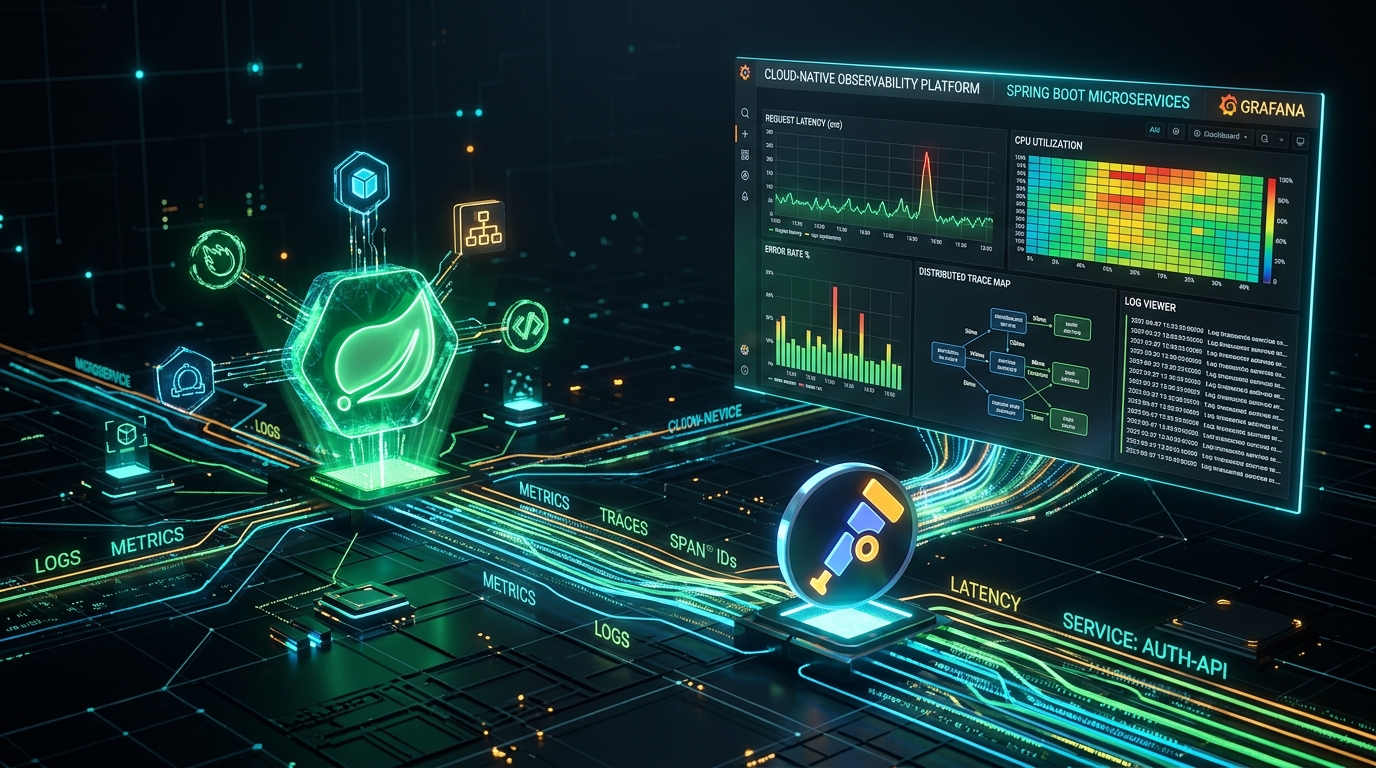
Modern cloud systems run across many small microservices and containers. When an error happens, finding the root cause is hard. Traditional log files on single servers cannot show the full story. A user request may touch five or six different applications before returning a response. If one database query slows down, the entire user experience suffers. This is why observability is essential for production systems today.
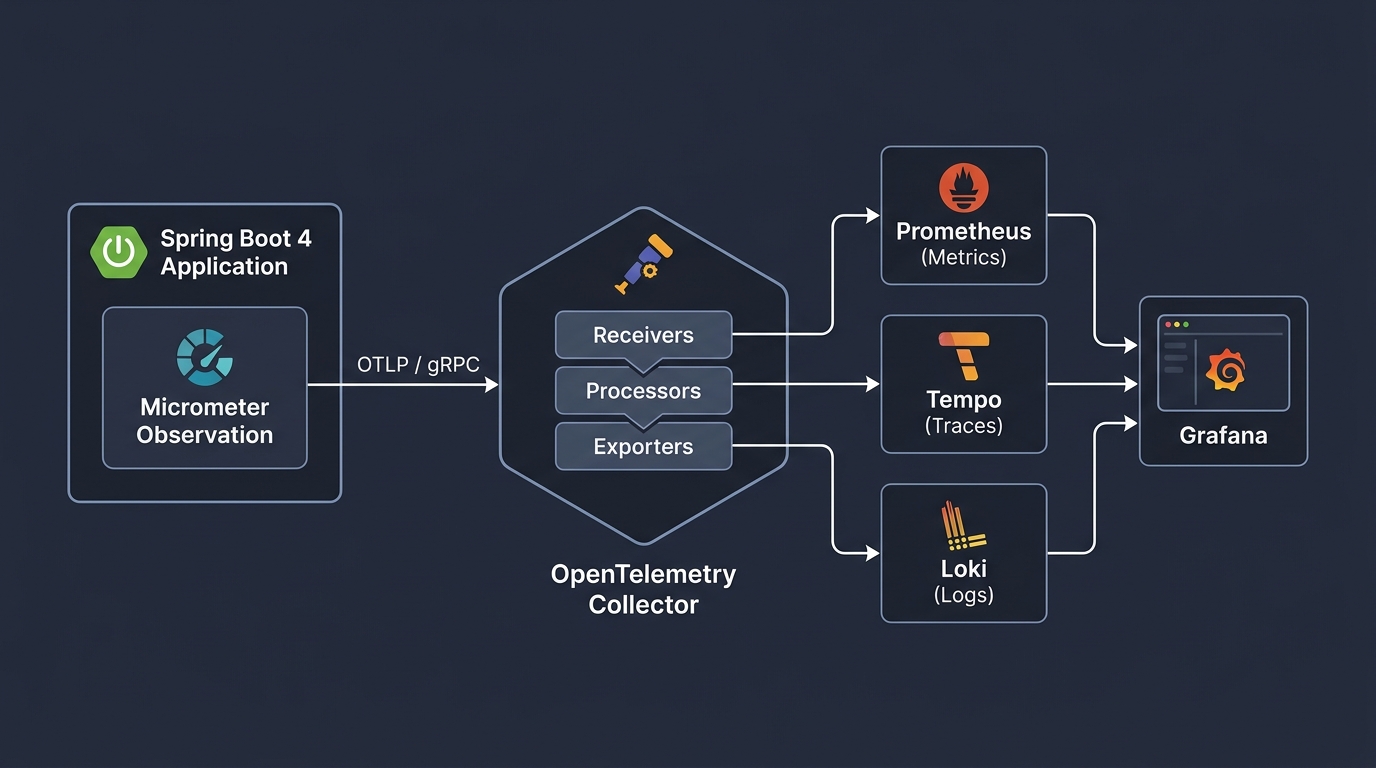
In this guide, you will learn how to build a production-grade observability pipeline with Spring Boot 4.0, Micrometer, OpenTelemetry (OTel), and the Grafana LGTM stack (Loki, Grafana, Tempo, and Mimir/Prometheus). We use practical examples, architectural diagrams, Java 25 code, configuration files, and troubleshooting steps written in simple, clear English.
Quick Index
- Why Observability Matters in Cloud-Native Systems
- The Three Pillars of Modern Telemetry
- OpenTelemetry and the Collector Pipeline Architecture
- Distributed Tracing and W3C Context Propagation
- Comparative Observability Matrix
- Configuring Spring Boot 4 Actuator and Micrometer
- Programmatic Instrumentation with Observation API
- The Grafana LGTM Visualization Stack
- Exemplars: Connecting Metrics Directly to Traces
- 3 Enterprise Real-World Case Studies
- 3 Production Anti-Patterns and Engineering Fixes
- Frequently Asked Questions (FAQ)
- Companion Workshop Code
- Official References
Why Observability Matters in Cloud-Native Systems
In traditional monolithic applications, debugging was simple. All code ran inside a single Java Virtual Machine (JVM). When an exception happened, you opened the server log file. You looked at the stack trace. The stack trace showed the exact file and line number. Everything happened on one machine with shared memory and local threads.
Cloud-native systems work differently. Today, applications are split into many independent microservices. Each service runs in its own Docker container or Kubernetes pod. When a user places an order in an e-commerce store, the request travels across an API Gateway, an Authentication Service, an Order Service, an Inventory Service, and a Payment Gateway. If the request fails or takes five seconds, which component is responsible?
Monitoring tells you when something is broken. Observability tells you why something is broken. Observability allows software engineers to infer the internal health and behavior of complex distributed systems by analyzing external telemetry data. Instead of guessing, you look at correlated metrics, traces, and logs. This visibility reduces the Mean Time to Detect (MTTD) and the Mean Time to Resolution (MTTR) during critical production incidents.
The Three Pillars of Modern Telemetry
Engineers organize observability data into three core data types. These data types are known as the three pillars of telemetry: metrics, distributed traces, and logs. Each pillar serves a unique purpose. When used together, they provide complete visibility into your software ecosystem.
1. Metrics: Numerical Aggregation
Metrics are numerical values measured over fixed intervals of time. Metrics tell you how your system performs as a whole. Examples include request rates per second, HTTP error rates, memory usage, CPU load, and garbage collection pause times. Metrics are lightweight. They do not store individual user data. Instead, they aggregate counts, gauges, and histograms. Because metrics take up very little disk space, you can store them for months or years to identify long-term capacity trends.
2. Distributed Traces: Request Journeys
A trace represents the end-to-end journey of a single transaction through your distributed infrastructure. When a client initiates a request, the first service creates a Trace ID. As the call moves across network boundaries to other microservices, the system creates smaller segments called Spans. Each span records the start time, end time, service name, operation name, and error status of a specific unit of work. Distributed tracing lets you see an exact timeline waterfall of every database query, cache lookup, and external HTTP call in a single transaction.
3. Structured Logs: Detailed Contextual Evidence
Logs are text records emitted by your application code during execution. A log entry describes an event that happened at an exact millisecond. In modern systems, logs must be structured as JSON key-value pairs rather than plain text strings. When your logging framework injects the active traceId and spanId into every log line, you can jump directly from a slow trace in your visualization tool to the exact debug log messages emitted by that request.
OpenTelemetry and the Collector Pipeline Architecture
In past years, companies suffered from vendor lock-in. If you used one monitoring product, you had to install its proprietary agent into your JVM. If your company switched vendors, developers had to rewrite all custom instrumentation code. This vendor lock-in created high costs and technical debt.
OpenTelemetry (OTel) solves this problem. OTel is an open-source standard hosted by the Cloud Native Computing Foundation (CNCF). It provides a single set of vendor-neutral APIs, SDKs, and wire protocols for collecting telemetry. The standard communication protocol is OTLP (OpenTelemetry Protocol). OTLP sends binary Protocol Buffer payloads over HTTP (port 4318) or gRPC (port 4317).
Receivers, Processors, and Exporters
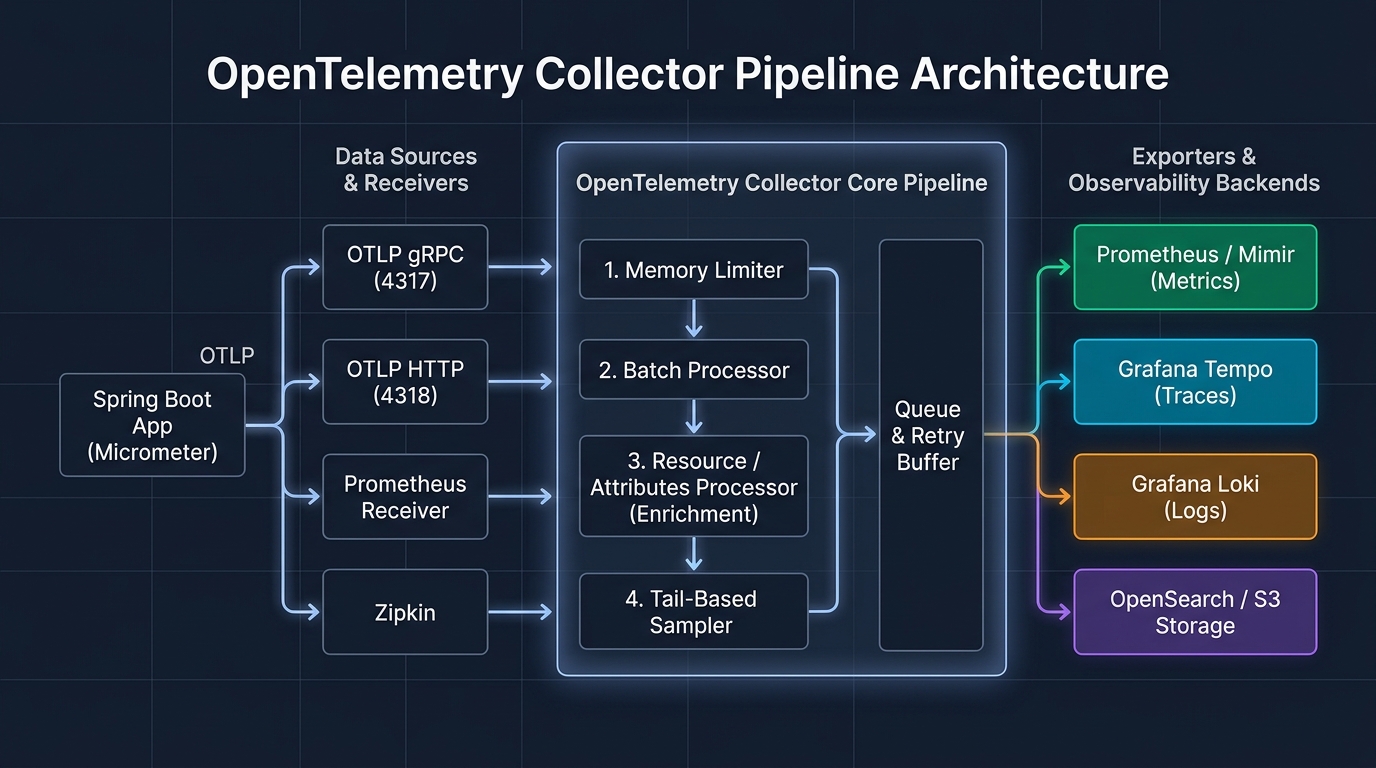
The OpenTelemetry Collector is a high-performance proxy component written in Go. Instead of sending data directly from every Spring Boot container to various backends, your containers send all telemetry to the local Collector. The Collector processes data in three pipeline stages:
- Receivers: Open network listeners that accept incoming data in multiple formats, such as OTLP gRPC, OTLP HTTP, Prometheus scrape endpoints, or Zipkin streams.
- Processors: Transform, enrich, and filter incoming telemetry. A Memory Limiter Processor drops or throttles traffic if memory runs low. A Batch Processor groups individual spans and metrics into compressed chunks. A Resource Processor adds environment attributes (like cluster name, region, and application version) to all telemetry automatically.
- Exporters: Translate the processed data into target formats and forward it over the network to storage databases such as Prometheus, Grafana Tempo, and Grafana Loki.
Distributed Tracing and W3C Context Propagation
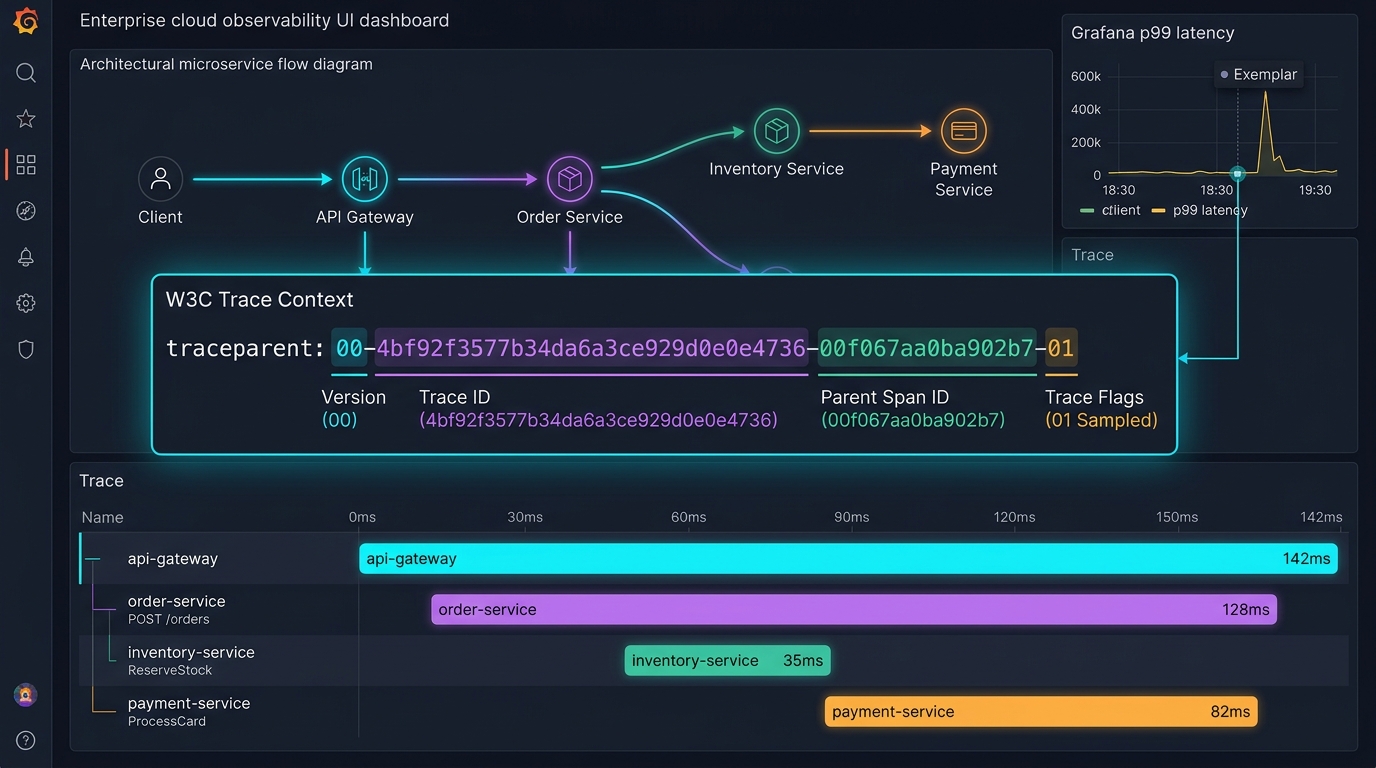
For distributed tracing to work across independent microservices, context must cross network boundaries. When Service A makes a REST call to Service B, Service B must know that its work is part of the existing trace created by Service A. The World Wide Web Consortium (W3C) established the W3C Trace Context standard to unify HTTP header propagation.
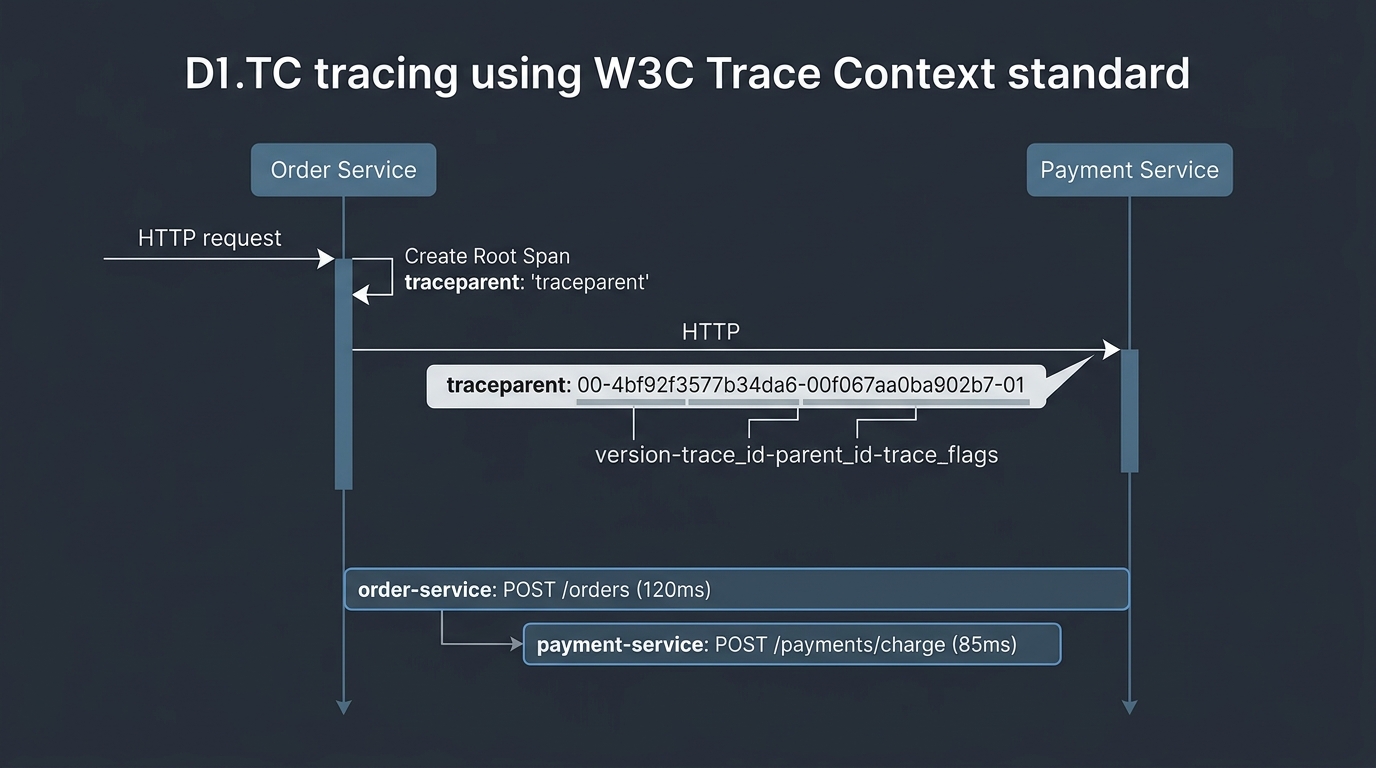
The primary header used in this standard is traceparent. The header contains four distinct fields separated by hyphens:
traceparent: 00-4bf92f3577b34da6a3ce929d0e0e4736-00f067aa0ba902b7-01
             │  └───────────────┬────────────────┘ └───────┬──────┘ └─┬┘
             │                  │                          │          │
Version Trace ID Span ID Flags- Version (00): The current specification version (2 hexadecimal characters).
- Trace ID (32 hex characters): The globally unique identifier for the entire distributed transaction. Every service involved in this request shares the exact same Trace ID.
- Span ID (16 hex characters): The identifier for the specific parent operation that initiated the outbound network call.
- Trace Flags (01): 8-bit flags that control recording behavior. A value of
01means the trace was sampled for detailed storage.
Comparative Observability Matrix
Choosing the right observability components requires understanding their operational characteristics, data formats, storage costs, and optimal use cases. The table below compares the primary observability mechanisms used in modern enterprise Java architectures:
| Mechanism | Primary Data Format | Storage Engine | Storage Cost | Debugging Value | Primary Enterprise Use Case |
|---|---|---|---|---|---|
| Prometheus Metrics | Aggregated Time-Series (RED, Gauges) | Prometheus / Grafana Mimir | Very Low | System-wide alerting & capacity trends | Detecting SLA violations, error rate spikes, and CPU bottlenecks |
| Structured Logs | JSON Text with correlated Trace IDs | Grafana Loki / Elasticsearch | Medium to High | High contextual detail for errors | Root-cause analysis of exceptions and audit trail verification |
| Distributed Traces | Span Trees (OTLP Protocol Buffers) | Grafana Tempo / Jaeger | Medium (with sampling) | Pinpoints exact downstream latency | Debugging slow multi-service API endpoints and timeout cascades |
| eBPF Telemetry | Linux Kernel Event Counters & Packets | Cilium / Pixie / Hubble | Low | Network packet loss & DNS delays | Zero-code network diagnostics without touching application code |
| Commercial APM Agents | Proprietary Bytecode Instrumentation | Vendor Cloud (Datadog / Dynatrace) | High (per-host pricing) | Automated deep method profiling | Out-of-the-box dashboards for enterprise teams lacking SRE staff |
| Micrometer OTLP | Vendor-Neutral OpenTelemetry Protobuf | OpenTelemetry Collector | Minimal runtime overhead | Full correlation across all 3 pillars | Modern Spring Boot 4 cloud-native standard microservice architectures |
| Database Connection Metrics | HikariCP JMX & Micrometer Gauges | Prometheus | Very Low | Detects connection pool starvation | Diagnosing database contention and connection acquisition latency |
| Continuous Profiling | Stack Trace Samples (Pprof format) | Grafana Pyroscope | Medium | Pinpoints exact lines eating CPU/RAM | Optimizing hot loops, garbage collection pauses, and memory leaks |
Configuring Spring Boot 4 Actuator and Micrometer
Spring Boot 4 features native support for the Micrometer Observation API. This unified abstraction lets you write instrumentation once. Micrometer then produces both Prometheus metrics and OpenTelemetry traces from the exact same observation event.
Actuator and OpenTelemetry Bridges
To enable OTLP metrics and distributed tracing in your Maven project, configure your pom.xml with the appropriate Micrometer starters and OpenTelemetry bridges. Spring Boot manages compatible dependency versions through its parent POM:
<dependencies>
    <!-- Spring Boot Production Actuator -->
    <dependency>
        <groupId>org.springframework.boot</groupId>
        <artifactId>spring-boot-starter-actuator</artifactId>
    </dependency>

    <!-- Micrometer OTLP Metric Registry -->
    <dependency>
        <groupId>io.micrometer</groupId>
        <artifactId>micrometer-registry-otlp</artifactId>
    </dependency>

    <!-- Micrometer Tracing Bridge for OpenTelemetry -->
    <dependency>
        <groupId>io.micrometer</groupId>
        <artifactId>micrometer-tracing-bridge-otel</artifactId>
    </dependency>

    <!-- OTLP Exporter over HTTP/gRPC -->
    <dependency>
        <groupId>io.opentelemetry</groupId>
        <artifactId>opentelemetry-exporter-otlp</artifactId>
    </dependency>
</dependencies>
Application Properties and Sampling Rate
Next, configure your src/main/resources/application.properties. We direct Spring Boot to export traces and metrics to the OpenTelemetry Collector container. We also configure the logging format to include the active traceId and spanId in every output line:
# Application Identity
spring.application.name=opentelemetry-grafana-demo

# Web Server Configuration
server.port=8080

# Expose All Actuator Management Endpoints
management.endpoints.web.exposure.include=health,info,metrics,prometheus

# Distributed Tracing Sampling (1.0 = 100% in local test, 0.1 = 10% in production)
management.tracing.sampling.probability=1.0

# OTLP Endpoints for OpenTelemetry Collector
management.otlp.tracing.endpoint=http://localhost:4318/v1/traces
management.otlp.metrics.endpoint=http://localhost:4318/v1/metrics
management.otlp.metrics.export.step=10s

# Automatic Correlation: Inject traceId and spanId into SLF4J / Logback MDC
logging.pattern.level=%5p [${spring.application.name:},%X{traceId:-},%X{spanId:-}]
When this logging pattern is active, your console logs display the exact trace context alongside every message:
 INFO [opentelemetry-grafana-demo,4bf92f3577b34da6a3ce929d0e0e4736,00f067aa0ba902b7] c.w.o.OrderService : Processing order standard-9821
DEBUG [opentelemetry-grafana-demo,4bf92f3577b34da6a3ce929d0e0e4736,00f067aa0ba902b7] c.w.o.OrderService : Deducting inventory for sku=482
Programmatic Instrumentation with Observation API
Spring Boot automatically instruments common web operations, including incoming HTTP REST controllers and database repositories. However, critical business workflows require custom measurement. The Micrometer Observation API provides an elegant, testable way to instrument custom Java logic.
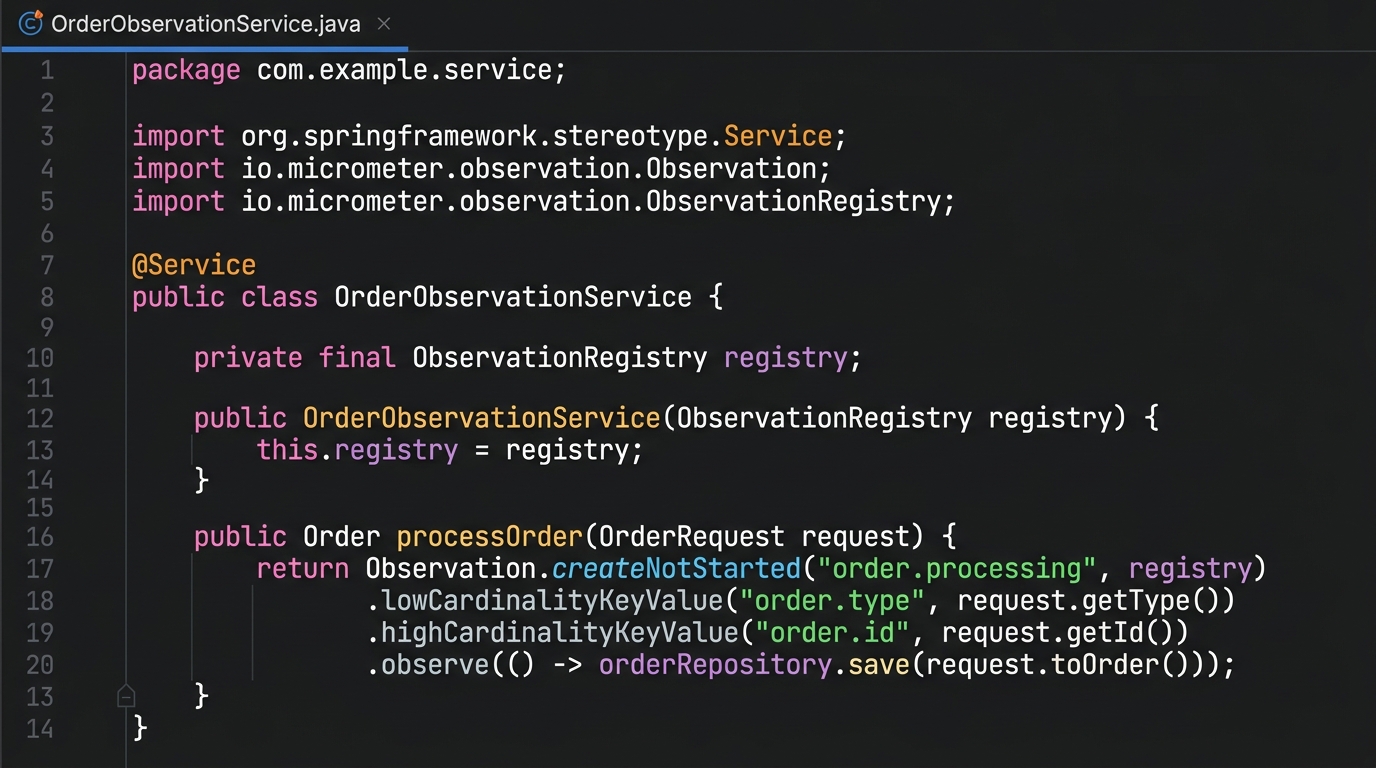
Here is the complete implementation of our OrderService.java service class from the workshop project:
package com.webcodein.observability;

import io.micrometer.observation.Observation;
import io.micrometer.observation.ObservationRegistry;
import org.slf4j.Logger;
import org.slf4j.LoggerFactory;
import org.springframework.stereotype.Service;

@Service
public class OrderService {

    private static final Logger log = LoggerFactory.getLogger(OrderService.class);
    private final ObservationRegistry registry;

    public OrderService(ObservationRegistry registry) {
        this.registry = registry;
    }

    public String processOrder(String orderId) {
        return Observation.createNotStarted("order.processing", registry)
                .lowCardinalityKeyValue("order.status", "submitted")
                .highCardinalityKeyValue("order.id", orderId)
                .observe(() -> {
                    log.info("Processing order business workflow for order: {}", orderId);

                    if ("fail".equalsIgnoreCase(orderId)) {
                        log.error("Intentional test failure triggered for order: {}", orderId);
                        throw new IllegalArgumentException("Invalid order: " + orderId);
                    }

                    try {
                        // Simulate external payment gateway latency
                        Thread.sleep(80);
                    } catch (InterruptedException e) {
                        Thread.currentThread().interrupt();
                        throw new IllegalStateException("Order processing was interrupted", e);
                    }

                    return "Order " + orderId + " completed successfully";
                });
    }
}
Notice the distinction between lowCardinalityKeyValue and highCardinalityKeyValue:
- Low Cardinality: Keys that have a bounded, small set of possible values (such as order status:
submitted,completed,failed). Micrometer safely attaches low-cardinality keys to Prometheus metrics and trace spans. - High Cardinality: Keys that have unique or infinite values (such as order IDs, user emails, UUIDs, or credit card tokens). Micrometer attaches these keys only to the distributed trace span. It excludes them from Prometheus metric tags to protect your metric storage from memory exhaustion.
The Grafana LGTM Visualization Stack
The LGTM stack is an integrated open-source observability platform developed by Grafana Labs. It consists of four complementary tools:
- Loki: A horizontally scalable, multi-tenant log aggregation system inspired by Prometheus. Unlike Elasticsearch, Loki does not index the full text of logs. It indexes only metadata labels (such as service name and environment), making it cost-effective and fast.
- Grafana: The universal visualization dashboard. It connects to Loki, Tempo, and Prometheus simultaneously, presenting metrics, traces, and logs in unified panels.
- Tempo: A high-scale, cost-effective distributed tracing backend. Tempo stores trace blocks directly in cheap object storage (such as Amazon S3, Google Cloud Storage, or MinIO).
- Mimir / Prometheus: Long-term time-series metric databases that store performance indicators, counters, and histograms.
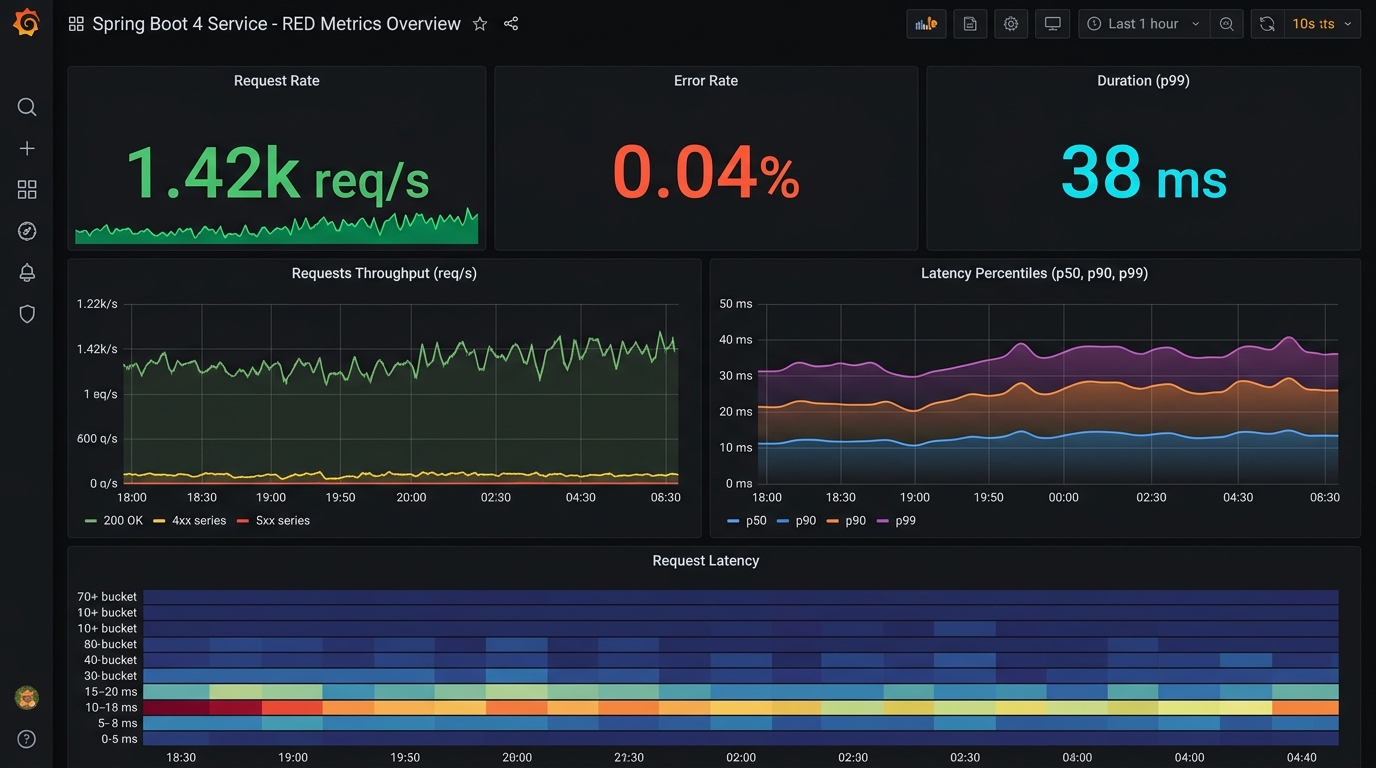
RED Metrics Dashboards
When designing production dashboards, industry best practices recommend the RED Method for request-driven microservices:
- Rate: The number of requests your service handles per second (measured via
http_server_requests_seconds_count). - Errors: The number of requests that fail per second (HTTP 5xx status codes or uncaught Java exceptions).
- Duration: The amount of time requests take to complete, visualized as p50, p95, and p99 percentile histograms.
Exemplars: Connecting Metrics Directly to Traces
One of the most powerful capabilities in the modern observability ecosystem is Exemplars. Traditionally, metrics and traces lived in separate silos. When an SRE saw a sudden latency spike on a Grafana chart, they had to copy timestamps, navigate to the tracing tool, and manually search through hundreds of traces hoping to find the slow one.
Exemplars bridge this gap permanently. An exemplar is a specific data sample attached to a metric histogram point. It contains a numerical value and the exact traceId of the transaction that produced that value. In Grafana, exemplars appear as clickable dots on your latency charts. When you click a dot representing a 3-second p99 latency spike, Grafana immediately opens a split panel displaying the exact distributed trace waterfall in Grafana Tempo. You jump from a high-level aggregate graph directly to the slow code line in less than two seconds.
3 Enterprise Real-World Case Studies
Case Study 1: E-Commerce Checkout Latency Spike Investigation
The Incident: During a peak retail promotion, an online retail platform experienced a sudden degradation in customer checkout performance. The average response time jumped from 220 milliseconds to 4.8 seconds. Customer checkout abandonments rose by 35% within twenty minutes.
Investigation Process: The platform engineering team opened the Grafana RED dashboard. The Duration panel showed clear latency outliers reaching 5,000 milliseconds. The engineers clicked an exemplar dot at the top of the p99 latency histogram. Grafana loaded the trace in Tempo immediately. The trace revealed five sequential spans:
API Gateway: POST /api/checkout(4,810ms total)Order Service: processOrder()(4,790ms)Inventory Service: checkStock()(35ms)Payment Service: authorizeCard()(4,680ms)Fraud Detection: evaluateRisk()(4,610ms)
The trace waterfall proved that the internal Order and Inventory microservices were healthy. The delay occurred inside the Fraud Detection service. The correlated Loki logs for that traceId revealed a socket timeout when connecting to an external third-party identity verification API. The team activated an emergency circuit breaker pattern, bypassing non-critical fraud checks for low-value purchases, and checkout response times dropped back to 210 milliseconds.
Case Study 2: FinTech Payment Gateway Cross-Service Audit
The Incident: A digital payments bank underwent a regulatory compliance audit. The financial regulator required proof that every money transfer transaction followed strict anti-tamper logging and that every service call could be audited from mobile app ingress to core banking settlement.
Resolution: The engineering team leveraged Spring Boot 4 Micrometer tracing with the W3C traceparent protocol. Every outbound RestClient and Kafka producer injected the active trace context into message headers. Core banking ledger writes recorded the immutable traceId alongside the cryptographic transaction record. Using Grafana Tempo and Loki log correlations, auditors could query a single transfer transaction and inspect every microservice call, database insert, and security authorization check in chronological sequence.
Case Study 3: High-Throughput Ingestion and Metric Cardinality Management
The Incident: A logistics telematics company ingested GPS sensor data from 120,000 delivery vehicles. An engineer added a custom metric tag recording vehicle_id on an HTTP request counter. Within two hours, Prometheus memory usage spiked from 14 GB to 128 GB, triggering an Out-Of-Memory (OOM) crash that crippled the alerting infrastructure.
Resolution: The team solved the issue by refactoring their instrumentation. They used Micrometer’s highCardinalityKeyValue("vehicle.id", vehicleId) so the identifier was attached exclusively to trace spans stored in Grafana Tempo. Furthermore, they added an attributes/filter processor in their OpenTelemetry Collector configuration to strip any unapproved high-cardinality labels before pushing metrics to Prometheus. Prometheus memory consumption stabilized at 8 GB.
3 Production Anti-Patterns and Engineering Fixes
Anti-Pattern 1: Unbounded High-Cardinality Metric Tags
The Mistake: Adding dynamic user identifiers, order numbers, IP addresses, or timestamps as tags in Prometheus metrics. Every unique combination of key-value pairs creates a new time series in memory. Ingesting one million unique customer IDs causes a catastrophic “cardinality explosion” that crashes Prometheus.
The Engineering Fix: Never use unbounded values in metrics. Use metric tags only for low-cardinality categorical data, such as HTTP method, response status family (2xx, 5xx), and environment. Put high-cardinality values inside trace attributes or structured log fields:
// WRONG: Cardinality Explosion in Prometheus
registry.counter("orders.created", "order.id", orderId).increment();

// CORRECT: Safe separation of metric and trace cardinality
Observation.createNotStarted("orders.created", registry)
    .lowCardinalityKeyValue("order.status", "success") // Stored in Prometheus
    .highCardinalityKeyValue("order.id", orderId)      // Stored only in Tempo
    .observe(() -> executeOrder());
Anti-Pattern 2: 100% Trace Sampling in High-Volume Production
The Mistake: Setting management.tracing.sampling.probability=1.0 in production environments that process tens of thousands of requests per second. Storing 100% of traces generates terabytes of telemetry data, leading to massive cloud storage bills and network saturation.
The Engineering Fix: In production, use probabilistic sampling (such as 0.05 for 5% of requests) or implement tail-based sampling inside the OpenTelemetry Collector. Tail-based sampling inspects completed traces in memory: it saves 100% of traces that contain HTTP errors or high latency, while sampling only 1% of normal 200 OK requests.
Anti-Pattern 3: Synchronous Blocking Telemetry Exports
The Mistake: Configuring telemetry exporters to send data synchronously over the network on the main application request thread. If the telemetry collector experiences a network delay, your customer-facing API threads become blocked, causing application timeouts.
The Engineering Fix: Always use asynchronous batch exporters. Configure the OpenTelemetry Collector with memory limiters, queue buffers, and retry timeouts. In Spring Boot, Micrometer exports metrics and traces using asynchronous background worker pools by default.
Frequently Asked Questions (FAQ)
What is the difference between Micrometer and OpenTelemetry in Spring Boot?
Micrometer is the standard facade API built into the Spring Framework ecosystem, functioning like SLF4J for telemetry. OpenTelemetry is a broader CNCF industry standard that defines wire protocols (OTLP), SDKs, and collectors. Spring Boot uses Micrometer Observation API in your Java application code, and the micrometer-tracing-bridge-otel forwards that telemetry directly into OpenTelemetry format.
What is the W3C Trace Context standard?
The W3C Trace Context is an official web standard that defines common HTTP headers for distributed tracing. The primary header is traceparent, which packages the specification version, a 32-hex-character Trace ID, a 16-hex-character Parent Span ID, and 8-bit trace flags. This standard ensures that microservices written in different languages (Java, Go, Python, Node.js) can propagate trace context seamlessly without custom headers.
What are Exemplars and why are they important?
Exemplars are specific trace identifiers linked directly to individual metric data points in a Prometheus histogram. In Grafana dashboards, exemplars appear as interactive clickable dots on latency charts. Clicking an exemplar immediately loads the corresponding distributed trace waterfall in Grafana Tempo, connecting aggregate metrics to granular trace spans instantly.
What causes a cardinality explosion in Prometheus?
A cardinality explosion occurs when high-variance or unbounded data—such as user IDs, UUIDs, email addresses, or timestamps—are used as label keys in Prometheus metrics. Each unique combination of label values allocates a new time-series database entry in memory. When millions of unique series are created, Prometheus runs out of memory (OOM) and crashes.
Does distributed tracing add noticeable performance overhead to Spring Boot?
When configured properly with asynchronous OTLP batch export and probabilistic sampling (for example, 1% to 10% in high-traffic environments), distributed tracing adds less than 1% to 2% CPU overhead and negligible latency to request execution. The OpenTelemetry Collector handles queuing, compression, and network transport out-of-process.
Companion Workshop Code
The companion project for this guide is fully tested on Java 25 and Spring Boot 4.0. It includes a complete Docker Compose environment with pre-configured containers for Grafana, Prometheus, Tempo, Loki, and the OpenTelemetry Collector.
You can clone and run the workshop repository from GitHub:
Webcodein Workshop: OpenTelemetry & Grafana in Spring Boot 4
To run the integration tests locally using Testcontainers, execute:
./mvnw clean verifyExplore related deep dives across our cloud-native architecture catalog:
- Compiling Spring Boot Applications into GraalVM Native Images
- Scaling High-Throughput I/O with Java 25 Virtual Threads
- Building Resilient Event-Driven Microservices with Apache Kafka
- Integration Testing Microservice Stacks with Testcontainers
- Designing Clean Domain Boundaries with Hexagonal Architecture
- Domain-Driven Design (DDD) Masterclass with Java 25 and Spring Boot