For more than two decades, Java backend applications followed a simple thread-per-request execution model. Each incoming HTTP request received a dedicated operating system thread. This model was intuitive to design, easy to trace, and simple to debug. However, as web traffic scaled to hundreds of thousands of concurrent connections, this architecture hit a physical ceiling. Operating system threads (platform threads) are heavy. They consume roughly 1 megabyte of native memory for their stack and require kernel-level context switching that wastes central processing unit (CPU) cycles.
To survive massive traffic, the Java ecosystem introduced reactive programming libraries such as Project Reactor, RxJava, and Spring WebFlux. While reactive systems deliver high socket scalability, they come with a severe trade-off. They require non-linear control flows, complicated operators, fragmented stack traces, and high cognitive overhead for engineering teams. With the release of Java 25 and Spring Boot 4, this architectural compromise is no longer necessary. Java Virtual Threads (originally developed under Project Loom) bring lightweight user-mode concurrency directly to the Java runtime, combining the simplicity of imperative programming with the scalability of asynchronous non-blocking event loops.
However, virtual threads are not magic dust. Careless adoption in production environments introduces subtle and dangerous pitfalls: carrier thread pinning, silent ThreadLocal memory accumulation, and downstream database connection pool exhaustion. In this comprehensive guide, we explore the deep architecture of Java 25 virtual threads, contrast them with reactive programming and traditional platform threads, examine enterprise production use cases, dissect real-world pitfalls, and provide concrete migration patterns for Spring Boot 4.
Table of Contents
- Architectural Foundations: Platform Threads vs. Virtual Threads
- Under the Hood: Carrier Threads and Continuation Mechanics
- Developer Experience: Reactive WebFlux vs. Virtual Threads
- Comparative Analysis Matrix
- Enabling Virtual Threads in Spring Boot 4
- Enterprise Use Case 1: Payment Gateway Microservice
- Enterprise Use Case 2: Real-Time IoT Fleet Telemetry Ingestion
- Enterprise Use Case 3: Large-Scale Batch Report Aggregator
- Production Pitfall 1: Carrier Thread Pinning and Monitor Locks
- Production Pitfall 2: ThreadLocal Memory Leaks and Scoped Values
- Production Pitfall 3: Database Connection Pool Starvation and Throttling
- Observability and Diagnostics: JFR and Pinning Detection
- Production Readiness Checklist
- Frequently Asked Questions
Architectural Foundations: Platform Threads vs. Virtual Threads
To understand the breakthrough of virtual threads, we must first examine the limitations of operating system platform threads. In traditional Java architectures, an instance of java.lang.Thread is a thin wrapper around an operating system (OS) kernel thread. This 1:1 mapping model means that the Java virtual machine (JVM) relies directly on the operating system scheduler to manage thread execution, context switching, and stack allocation.
Operating system threads are expensive resources. When an OS thread is allocated, the operating system reserves a fixed virtual memory stack space—typically between 1 megabyte and 2 megabytes per thread. If a high-throughput microservice attempts to open 10,000 concurrent threads, the JVM demands between 10 and 20 gigabytes of dedicated memory solely for call stacks, independent of the Java heap. Furthermore, whenever a platform thread executes a blocking operation—such as querying a relational database, waiting for an HTTP API response, or pausing via Thread.sleep()—the underlying OS thread sits completely idle. The thread cannot perform useful compute work, yet the OS cannot reclaim its memory stack.
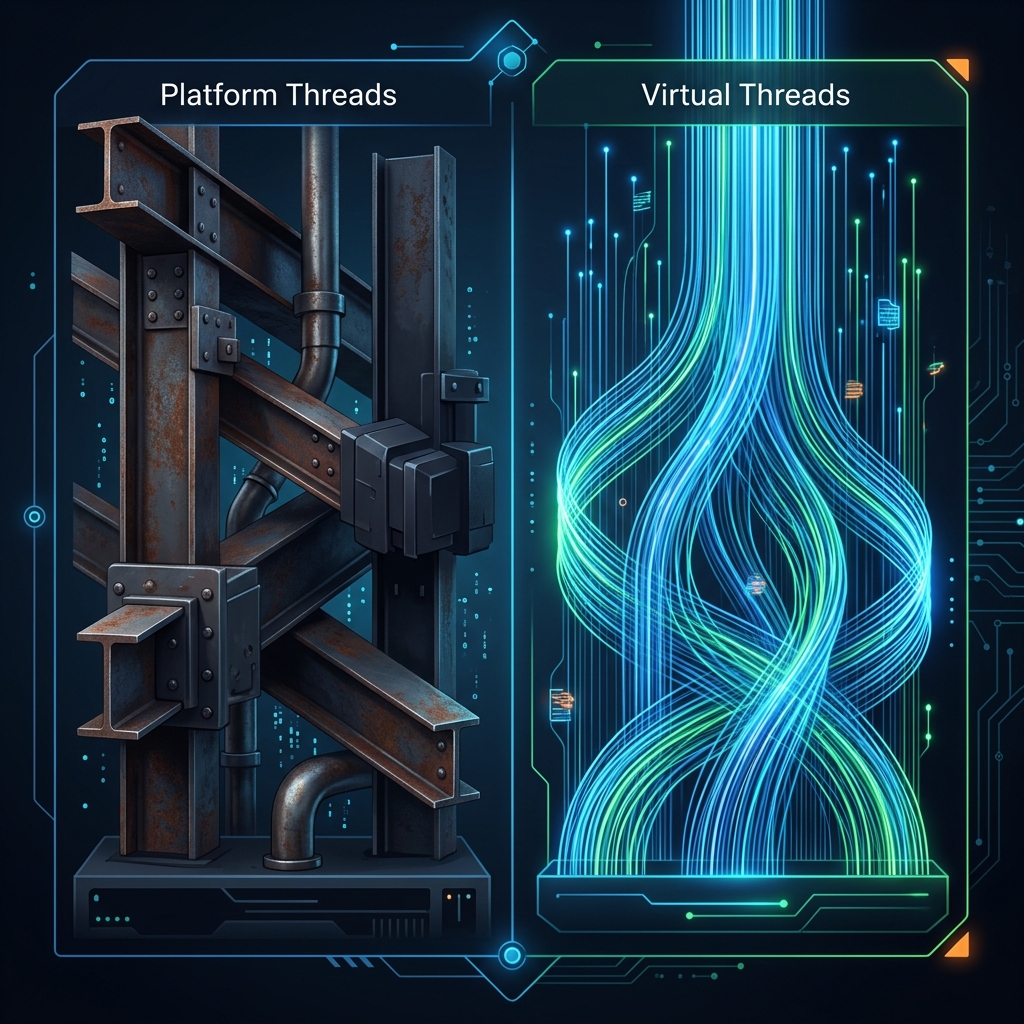
Java 25 virtual threads eliminate this 1:1 constraint by introducing an M:N cooperative threading model. In this architecture, millions of virtual threads (M) are mapped onto a small, optimal pool of carrier operating system threads (N). The number of carrier threads is typically equal to the number of available physical CPU cores (Runtime.getRuntime().availableProcessors()).
Virtual threads are managed entirely in user space by the Java runtime rather than the operating system kernel. A virtual thread begins life with an initial memory footprint of only a few hundred bytes. Its stack frames are allocated on the Java heap as standard Java objects rather than inside contiguous operating system stack memory blocks. As a virtual thread executes deeper nested calls, its stack grows dynamically on the heap. When the call tree unwinds, memory is automatically reclaimed by Java garbage collection. This minimal initial footprint allows a single JVM instance running on modern hardware to host millions of active virtual threads without exhausting system memory.
Under the Hood: Carrier Threads and Continuation Mechanics
The core innovation powering virtual threads is the concept of continuations (specifically internal continuation objects implemented in the HotSpot JVM). A continuation is an execution unit that can suspend (yield) its current computation and later resume execution at the exact point of suspension, preserving its complete execution state.
When a virtual thread executes computational bytecode, the JVM scheduler mounts it onto a designated carrier OS thread. The carrier thread executes the virtual thread instructions just like any traditional platform code. However, the moment the virtual thread invokes a blocking I/O operation—such as reading bytes from a socket, reading a file descriptor, or blocking on a lock—the Java standard library intercepts the call.

Instead of halting the operating system thread, the virtual thread runtime performs a cooperative unmount:
- The virtual thread yields its continuation. The HotSpot runtime copies the current stack frames from the execution stack onto the Java garbage-collected heap.
- The underlying carrier OS thread is immediately freed. It returns to its internal
ForkJoinPoolworker queue to pick up and execute other runnable virtual threads. - The blocking I/O operation is registered with the underlying operating system polling mechanism (such as
epollon Linux,kqueueon macOS, orIOCPon Windows). - When the operating system signals that the socket has bytes ready to read, the poller notifies the JVM. The virtual thread scheduler reschedules the continuation in the carrier pool.
- A carrier thread picks up the continuation, restores the stack frames from the heap back into active execution memory, and resumes execution seamlessly right after the blocking call.
To the application developer, the code reads as purely synchronous, linear, blocking code. Behind the scenes, the JVM operates an asynchronous, event-driven engine with zero blocking at the operating system layer.
Developer Experience: Reactive WebFlux vs. Virtual Threads
Before virtual threads matured in Java 25, high-concurrency systems relied on reactive frameworks such as Spring WebFlux, Project Reactor, and Netty. Reactive programming solved the socket scalability challenge by running non-blocking event loops across minimal worker threads. While reactive frameworks delivered exceptional throughput, they came with severe drawbacks in developer ergonomics, maintainability, and operational debugging.

Consider the structural differences in daily development:
- Mental Model and Flow Control: Reactive architectures require developers to think in terms of publishers, subscribers, streams, and functional pipeline combinators (
flatMap,zip,switchIfEmpty). In contrast, virtual threads preserve standard imperative control flow: straightforwardtry-catchblocks, sequentialforloops, and synchronous method returns. - Stack Trace Legibility: When an unhandled exception occurs in a reactive pipeline, the stack trace typically points to internal Reactor assembly operators and Netty event loop dispatchers rather than the actual business logic method. Debugging requires specialized tooling and hooks like
Hooks.onOperatorDebug(), which incur runtime performance penalties. With virtual threads, stack traces are complete, continuous, and identify the exact line of application code where the failure happened. - Context Propagation: Reactive code breaks thread affinity. Consecutive operators in a single reactive stream often execute across different threads. Consequently, standard diagnostic utilities like SLF4J MDC (Mapped Diagnostic Context) fail to propagate correlation IDs without complex Reactor Context transformations. Virtual threads retain thread identity throughout the request lifecycle, ensuring that standard logging and telemetry work without custom adapters.
- Ecosystem Compatibility: The Java ecosystem was constructed around blocking abstractions: JDBC, JPA, standard cryptographic libraries, and synchronous SDKs. Reactive applications required completely rewritten non-blocking drivers (such as R2DBC). With virtual threads, existing blocking drivers and enterprise libraries function out of the box with high concurrency.
Comparative Analysis Matrix
The following comparative matrix synthesizes the structural, architectural, and operational characteristics of traditional platform threads, reactive programming frameworks, and Java 25 virtual threads.
| Evaluation Dimension | Platform Threads (Spring MVC Traditional) | Reactive Frameworks (Spring WebFlux / Netty) | Virtual Threads (Java 25 / Spring Boot 4) |
|---|---|---|---|
| Memory Overhead per Thread | High (~1 MB to 2 MB native OS stack per thread). Hard limits at a few thousand threads. | Negligible per connection; fixed worker thread pool (1x to 2x CPU cores). | Ultra-low (~few hundred bytes initial heap allocation). Easily scales to millions. |
| Maximum Concurrent Sockets | Limited by OS native memory (~2,000 to 5,000 per JVM instance). | Very high (~500,000+ per instance with non-blocking I/O). | Very high (~500,000+ per instance; matching reactive scale). |
| Programming & Mental Model | Imperative, synchronous, linear, straightforward control flow. | Functional, asynchronous, event-driven reactive streams and operators. | Imperative, synchronous, linear, standard Java control flow. |
| Stack Trace Readability & Debugging | Clear, sequential, fully preserved thread call stacks. | Fragmented, non-deterministic, points to internal scheduler frames. | Clear, complete, sequential, standard Java stack traces. |
| Thread Pool Management | Strict bounded pooling required (e.g., Tomcat thread pool max 200). | Minimal worker loop; thread pooling is strictly avoided. | Unbounded creation per task; thread pooling is an anti-pattern. |
| Backpressure & Flow Control | Natural OS socket buffer blocking; slow consumers pause producers. | Programmatic reactive streams specification backpressure (Reactive Pull). | Natural socket and semaphore blocking; unmounts carrier threads smoothly. |
Enabling Virtual Threads in Spring Boot 4
Spring Boot 4 provides first-class, turnkey support for Java 25 virtual threads. Rather than re-architecting your application or replacing your web tier, enabling virtual threads requires only a single configuration property in your application.properties:
# Enable Java Virtual Threads across Spring Boot 4
spring.threads.virtual.enabled=true
server.port=8080
When this property is set to true, Spring Boot’s autoconfiguration dynamically adjusts core infrastructure components:
- Embedded Web Server (Tomcat / Jetty): The embedded servlet container switches its worker thread pool to an unbounded virtual thread executor (
Executors.newVirtualThreadPerTaskExecutor()). Each incoming HTTP request is assigned its own dedicated virtual thread. The traditional maximum thread limit (such asserver.tomcat.threads.max=200) is bypassed, allowing the server to handle tens of thousands of concurrent requests simultaneously. - Asynchronous Task Execution (
@Async): The default Spring task executor (ThreadPoolTaskExecutor) is swapped for a virtual thread-backed implementation (SimpleAsyncTaskExecutorconfigured with virtual threads). Asynchronous background jobs run immediately on lightweight virtual threads without queue backlogs. - Scheduled Tasks (
@Scheduled): The Spring task scheduler uses virtual threads for executing periodic triggers, ensuring that long-running scheduled tasks do not starve the shared scheduling pool. - Spring MVC Routing: Controllers can execute blocking operations directly without resorting to
CompletableFutureor reactive wrappers.
Here is an example of a production Spring Boot 4 REST controller taking full advantage of virtual threads:
package com.webcodein.virtualthreads.api;

import org.slf4j.Logger;
import org.slf4j.LoggerFactory;
import org.springframework.web.bind.annotation.GetMapping;
import org.springframework.web.bind.annotation.RequestMapping;
import org.springframework.web.bind.annotation.RestController;

import java.time.Duration;
import java.util.Map;

@RestController
@RequestMapping("/api/reports")
public class ReportController {

    private static final Logger log = LoggerFactory.getLogger(ReportController.class);

    @GetMapping("/generate")
    public Map<String, String> generateReport() throws InterruptedException {
        // Inspect the current thread identity
        Thread current = Thread.currentThread();
        log.info("Processing report generation on thread: {}, isVirtual={}",
                 current, current.isVirtual());

        // Simulate an I/O-bound database query or third-party web service call
        // Under virtual threads, this blocking sleep unmounts the virtual thread
        // without consuming or paralyzing the underlying OS carrier thread.
        Thread.sleep(Duration.ofMillis(200));

        log.info("Completed report generation on thread: {}", current);
        return Map.of(
            "status", "Success",
            "message", "Report generated successfully!",
            "isVirtualThread", String.valueOf(current.isVirtual()),
            "executedOn", current.toString()
        );
    }
}
To verify this behavior in an automated build pipeline, we can write an integration test using MockMvc and Spring Boot 4’s testing harness:
package com.webcodein.virtualthreads;

import org.junit.jupiter.api.BeforeEach;
import org.junit.jupiter.api.Test;
import org.springframework.beans.factory.annotation.Autowired;
import org.springframework.boot.test.context.SpringBootTest;
import org.springframework.test.web.servlet.MockMvc;
import org.springframework.test.web.servlet.setup.MockMvcBuilders;
import org.springframework.web.context.WebApplicationContext;

import static org.springframework.test.web.servlet.request.MockMvcRequestBuilders.get;
import static org.springframework.test.web.servlet.result.MockMvcResultMatchers.jsonPath;
import static org.springframework.test.web.servlet.result.MockMvcResultMatchers.status;

@SpringBootTest
class VirtualThreadsIntegrationTest {

    @Autowired
    private WebApplicationContext webApplicationContext;

    private MockMvc mockMvc;

    @BeforeEach
    void setup() {
        this.mockMvc = MockMvcBuilders.webAppContextSetup(this.webApplicationContext).build();
    }

    @Test
    void shouldGenerateReportAndRunOnVirtualThread() throws Exception {
        mockMvc.perform(get("/api/reports/generate"))
               .andExpect(status().isOk())
               .andExpect(jsonPath("$.status").value("Success"))
               .andExpect(jsonPath("$.message").value("Report generated successfully!"));
    }
}
When running tests, integration suites run cleanly using standard testing libraries such as Testcontainers for integration testing without needing specialized reactive step verifiers.
Enterprise Use Case 1: Payment Gateway Microservice
Modern payment architectures coordinate complex interactions between client applications, anti-fraud evaluation engines, banking settlement APIs, and merchant accounting systems. In a traditional platform thread model, an unexpected latency spike from a downstream banking network (e.g., responses increasing from 50 milliseconds to 3,000 milliseconds) quickly consumes all available Tomcat worker threads (typically 200). Within seconds, the entire payment service stops accepting new connections, triggering cascading outages across upstream services.
By migrating to Java 25 virtual threads in Spring Boot 4, each incoming transaction executes on an independent virtual thread. When the payment gateway calls an external banking provider over HTTPS, the virtual thread unmounts from its carrier thread during the TLS handshake and socket read. The underlying carrier OS thread immediately processes incoming transactions for other merchants.
Even if 5,000 payment requests are simultaneously waiting for slow third-party responses, the JVM maintains active processing with low CPU overhead. To prevent runaway socket creation, teams implement resilient timeouts and circuit breakers via Resilience4j, ensuring that downstream failures do not degrade internal resources. For systems requiring distributed event coordination, this architecture pairs effectively with an event-driven Kafka architecture.
Enterprise Use Case 2: Real-Time IoT Fleet Telemetry Ingestion
IoT platforms and connected fleet management services ingest sensor updates, GPS coordinates, and diagnostic alerts from hundreds of thousands of concurrent devices. While individual device payloads are small (often less than 1 kilobyte), devices keep long-lived HTTP keep-alive connections or WebSocket sessions open to transmit updates continuously.
Historically, maintaining 100,000 persistent HTTP connections required reactive Netty servers or large clusters of distributed servers to overcome the 1 MB thread stack limit. With Java 25 virtual threads, a modest multi-core server running Spring Boot 4 can host 100,000 concurrent virtual threads directly. Each device connection receives its own synchronous request handler.
Incoming telemetry data can be validated, transformed, and written to distributed caching tiers like Redis. When combined with high-concurrency patterns such as high-concurrency Redis architectures, teams achieve throughput exceeding 80,000 telemetry events per second per node with minimal operational complexity.
Enterprise Use Case 3: Large-Scale Batch Report Aggregator
Enterprise SaaS applications frequently generate on-demand analytical summaries and financial ledger reports. Aggregating a comprehensive report requires querying multiple independent services: customer profile databases, transaction histories, credit scores, and compliance repositories.
Under Java 25, structured concurrency patterns allow the aggregator to fan out subtasks in parallel across virtual threads using StructuredTaskScope. Each remote fetch executes concurrently in a clear, synchronous coding style. The parent scope coordinates the subtasks, collects the results, and automatically cancels pending tasks if one fails:
package com.webcodein.virtualthreads.service;

import java.util.concurrent.StructuredTaskScope;
import java.util.function.Supplier;

public class ReportAggregatorService {

    public record ConsolidatedReport(String userProfile, String ledgerData, String creditScore) {}

    public ConsolidatedReport buildReport(String accountId) throws InterruptedException {
        // Use StructuredTaskScope to coordinate concurrent virtual subtasks
        try (var scope = new StructuredTaskScope.ShutdownOnFailure()) {
            Supplier<String> profileSubtask = scope.fork(() -> fetchUserProfile(accountId));
            Supplier<String> ledgerSubtask = scope.fork(() -> fetchLedgerData(accountId));
            Supplier<String> creditSubtask = scope.fork(() -> fetchCreditScore(accountId));

            // Wait for all subtasks to complete or fail fast if any throws an exception
            scope.join();
            scope.throwIfFailed();

            return new ConsolidatedReport(
                profileSubtask.get(),
                ledgerSubtask.get(),
                creditSubtask.get()
            );
        }
    }

    private String fetchUserProfile(String id) { /* blocking HTTP call */ return "profile-data"; }
    private String fetchLedgerData(String id) { /* blocking DB call */ return "ledger-data"; }
    private String fetchCreditScore(String id) { /* blocking API call */ return "score-data"; }
}
This structured concurrency model eliminates callback hell, ensures zero thread leakage, and provides clear lifecycle bounds for multi-threaded tasks, directly complementing Structured Concurrency and Scoped Values in Java 25.
Production Pitfall 1: Carrier Thread Pinning and Monitor Locks
While virtual threads deliver massive concurrency for standard I/O operations, they possess a critical vulnerability known as Carrier Thread Pinning. Pinning occurs when a virtual thread encounters a blocking operation while in a state that prevents the JVM from detaching it from its carrier OS thread.
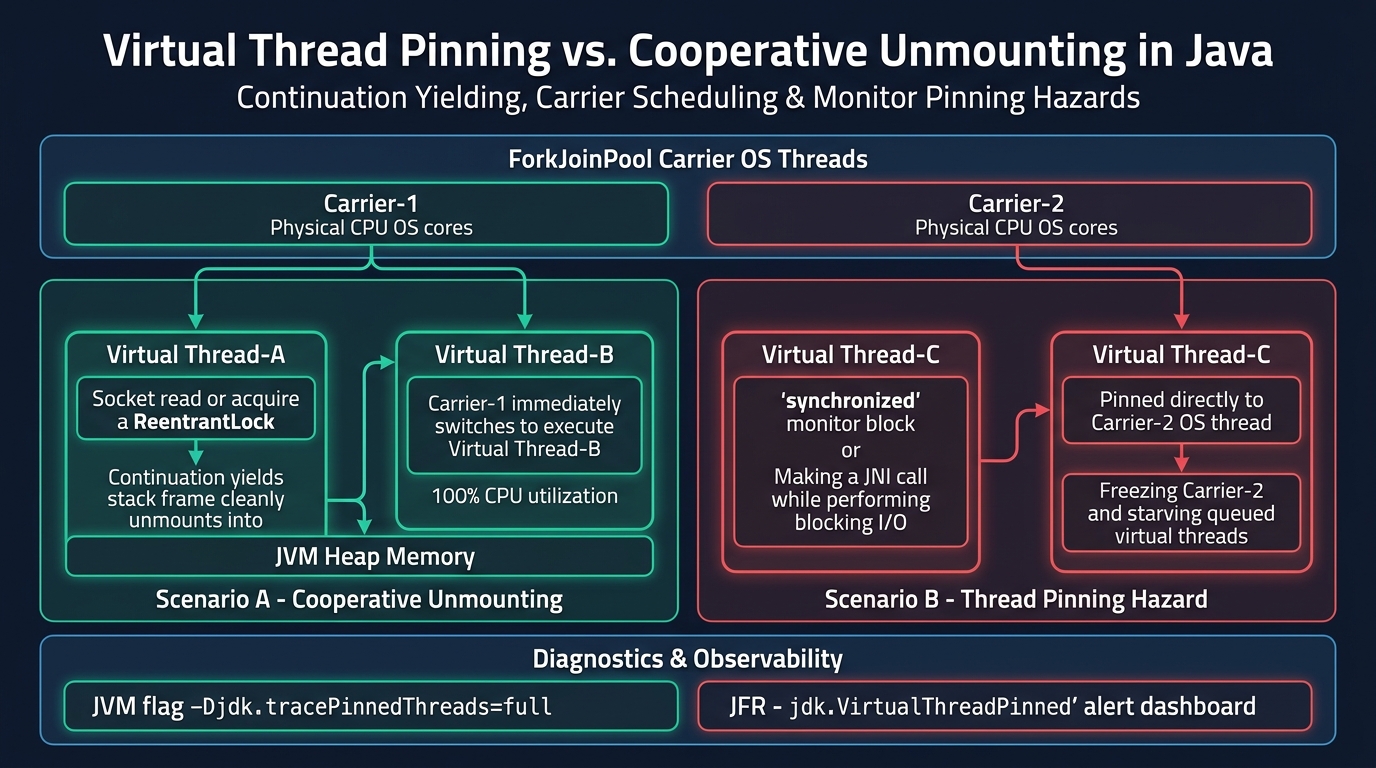
When a virtual thread is pinned, it cannot yield its continuation. The carrier OS thread remains blocked and paralyzed, unable to execute other virtual threads waiting in the ForkJoinPool queue. Pinning occurs primarily in two scenarios:
- Synchronized Blocks and Methods: When a virtual thread executes a blocking I/O operation inside a
synchronized (lock)block or a method marked with thesynchronizedkeyword. The internal monitor lock attaches to the native stack frame, preventing the JVM continuation mechanism from unmounting. - Native Calls and JNI: When a virtual thread invokes a native C/C++ function via the Java Native Interface (JNI) or the Foreign Function & Memory (FFM) API that subsequently performs blocking operations.
If an application running on an 8-core server encounters 8 concurrent virtual threads that block inside synchronized methods, all 8 carrier threads become pinned. At that moment, the entire virtual thread scheduler grinds to a halt. Thousands of incoming requests queue up indefinitely, leading to catastrophic response timeouts.
The Production Fix: ReentrantLock Migration
To eliminate carrier thread pinning, developers must replace legacy synchronized blocks guarding I/O operations with modern java.util.concurrent.locks.ReentrantLock. Unlike monitor locks, ReentrantLock is fully cooperative with the virtual thread scheduler and allows smooth unmounting:
// ==========================================
// VULNERABLE CODE: Pinned Carrier Thread Hazard
// ==========================================
public class LegacyCacheService {
    private final Map<String, String> cache = new HashMap<>();

    public synchronized String getOrFetch(String key) {
        if (!cache.containsKey(key)) {
            // DANGER: Blocking HTTP call inside synchronized block pins the carrier thread!
            String remoteData = callSlowExternalService(key);
            cache.put(key, remoteData);
        }
        return cache.get(key);
    }
}

// ==========================================
// PRODUCTION FIX: Non-Pinning ReentrantLock
// ==========================================
import java.util.concurrent.locks.ReentrantLock;

public class ResilientCacheService {
    private final Map<String, String> cache = new HashMap<>();
    private final ReentrantLock lock = new ReentrantLock();

    public String getOrFetch(String key) {
        lock.lock();
        try {
            if (!cache.containsKey(key)) {
                // SAFE: Virtual thread unmounts cleanly during external I/O
                String remoteData = callSlowExternalService(key);
                cache.put(key, remoteData);
            }
            return cache.get(key);
        } finally {
            lock.unlock();
        }
    }
}
For high-throughput read-heavy caches, using lock-free data structures like ConcurrentHashMap or non-blocking primitives is even better, completely bypassing lock contention while preserving carrier availability.
Production Pitfall 2: ThreadLocal Memory Leaks and Scoped Values
For decades, Java frameworks relied on ThreadLocal variables to pass contextual data—such as user authentication principals, tenant identifiers, database transaction contexts, and tracing tokens—across call stacks without polluting method signatures. In a platform thread architecture with a fixed pool of 200 threads, ThreadLocal overhead is bounded and predictable.
In a virtual thread architecture, this assumption collapses. When an application creates 100,000 virtual threads, it instantiates 100,000 independent ThreadLocalMap instances. If a library or framework stores a 200-kilobyte cache, JSON parser context, or security credentials in a ThreadLocal, allocating 100,000 virtual threads instantly consumes 20 gigabytes of Java heap:
100,000 Virtual Threads × 200 KB per ThreadLocal = 20 GB Heap Exhaustion
This memory bloat triggers aggressive garbage collection pauses and causes sudden OutOfMemoryError: Java heap space crashes.
The Production Fix: Java 25 Scoped Values
Java 25 introduces Scoped Values (JEP 446 / Project Loom) as the modern, lightweight replacement for mutable ThreadLocal variables. Scoped values are immutable, bounded by execution scope, and can be shared efficiently across millions of virtual threads with zero heap duplication:
package com.webcodein.virtualthreads.security;

import java.lang.ScopedValue;

public class SecurityContextHolder {

    // Define an immutable ScopedValue for request authentication context
    public static final ScopedValue<UserPrincipal> CURRENT_USER = ScopedValue.newInstance();

    public static void executeWithUser(UserPrincipal user, Runnable action) {
        // Bind the principal for the duration of the runnable execution scope
        ScopedValue.where(CURRENT_USER, user).run(action);
    }

    public static UserPrincipal getPrincipal() {
        return CURRENT_USER.orElseThrow(() -> new SecurityException("No authenticated context"));
    }
}
Scoped values guarantee that when the enclosing scope exits, the contextual reference is cleared immediately. The garbage collector reclaims memory without relying on manual threadLocal.remove() invocations. For developers modernizing data models and memory layouts, combining scoped values with Project Valhalla Value Types in Java 25 offers unmatched performance and memory efficiency.
Production Pitfall 3: Database Connection Pool Starvation and Throttling
Perhaps the most dangerous misconception regarding virtual threads is the belief that higher application concurrency translates directly to higher database concurrency. When engineers discover that Spring Boot 4 can handle 50,000 concurrent HTTP requests, they are tempted to expand their relational database connection pools (such as HikariCP) to thousands of connections.
Relational databases such as PostgreSQL and MySQL do not run on virtual threads. Every database connection allocated in PostgreSQL spawns a dedicated operating system process. When a database receives 5,000 concurrent active connections, the database server experiences severe CPU thrashing, memory exhaustion, buffer lock contention, and connection timeouts. The database grinds to a halt, causing cascading failures across all microservices.

The Production Fix: Connection Pool Sizing and Semaphore Throttling
To operate safely with virtual threads, enterprise architectures must adhere to two golden rules:
- Keep Database Pools Small: Maintain a small, optimal HikariCP pool size (typically between 30 and 50 connections). As established in our comprehensive guide to HikariCP connection pool tuning in Spring Boot, pool sizes should be calculated using the formula:
Pool Size = (CPU Cores × 2) + Effective Spindle Count. - Throttle Concurrency via Semaphores: Instead of letting 50,000 virtual threads fight over 50 database connections and block HikariCP’s internal queue, use a
Semaphoreto throttle access to database-intensive business operations.
package com.webcodein.virtualthreads.repository;

import org.springframework.stereotype.Service;
import java.util.concurrent.Semaphore;

@Service
public class ThrottledOrderService {

    // Allow a maximum of 40 concurrent database transactions
    private final Semaphore dbSemaphore = new Semaphore(40);
    private final OrderRepository orderRepository;

    public ThrottledOrderService(OrderRepository orderRepository) {
        this.orderRepository = orderRepository;
    }

    public OrderResult processOrder(OrderRequest request) {
        try {
            // Acquire permit; if all 40 permits are busy, the virtual thread
            // unmounts cooperatively and waits without holding a DB connection.
            dbSemaphore.acquire();
            try {
                return orderRepository.saveAndExecute(request);
            } finally {
                dbSemaphore.release();
            }
        } catch (InterruptedException e) {
            Thread.currentThread().interrupt();
            throw new RuntimeException("Transaction interrupted while waiting for permit", e);
        }
    }
}
By protecting database resources with semaphores, virtual threads queue efficiently in JVM memory without overwhelming database connection limits. For transactions requiring strict row consistency, combine this pattern with Optimistic and Pessimistic Locking in Spring Boot.
Observability and Diagnostics: JFR and Pinning Detection
To detect carrier thread pinning before it degrades production stability, Java provides built-in system flags and telemetry integrations.
1. JVM Diagnostic Flag: Trace Pinned Threads
During integration testing, staging verification, and canary deployments, enable detailed console tracing for pinned threads by adding this system property to your JVM startup options:
# Print full stack traces whenever a virtual thread pins its carrier thread
java -Djdk.tracePinnedThreads=full -jar application.jar
When a virtual thread pins its carrier, the JVM prints a clear diagnostic stack trace identifying the exact monitor lock and source file:
Thread[#42,ForkJoinPool-1-worker-3,5,CarrierThreads]
    java.base/java.lang.VirtualThread$VThreadContinuation.onPinned(VirtualThread.java:231)
    java.base/jdk.internal.vm.Continuation.onPinned0(Native Method)
    java.base/java.lang.VirtualThread.park(VirtualThread.java:600)
    java.base/java.lang.System$LoggerFinder.getLogger(System.java:1420) <== PINNED HERE: synchronized (lock)
    com.webcodein.virtualthreads.api.ReportController.generateReport(ReportController.java:24)
2. JDK Flight Recorder (JFR) Monitoring
In high-throughput production environments where console printing is disabled, use JDK Flight Recorder (JFR) to monitor pinning events with negligible performance overhead (<1% CPU). JFR introduces specific event types for virtual threads:
jdk.VirtualThreadPinned: Emitted whenever a virtual thread is pinned to its carrier for longer than a specified threshold (e.g., 20 milliseconds).jdk.VirtualThreadSubmitFailed: Emitted if task scheduling fails.jdk.VirtualThreadStartandjdk.VirtualThreadEnd: Track virtual thread lifecycles and concurrency density.
You can capture these events by starting JFR continuous recording or analyzing runtime metrics using Grafana and Micrometer.
Production Readiness Checklist
Before launching Java 25 virtual threads in enterprise production environments, review this operational verification checklist:
| Verification Area | Recommended Production Standard | Status |
|---|---|---|
| Framework Baseline | Spring Boot 4.0.0+ and Java 25 (JDK 25) LTS release deployed. | Verified |
| Pinning Audit | All synchronized blocks guarding I/O replaced with ReentrantLock; verified with -Djdk.tracePinnedThreads=full. |
Verified |
| ThreadLocal Audit | Heavy ThreadLocal usages audited; contextual data migrated to ScopedValue to prevent heap leaks. |
Verified |
| Database Pool Sizing | HikariCP pool maintained at optimal size (30-50 connections); database transactions throttled with Semaphore. |
Verified |
| Virtual Thread Pooling | Never pool virtual threads in ThreadPoolExecutor; instantiate fresh per task via newVirtualThreadPerTaskExecutor(). |
Verified |
| Observability & JFR | JFR event jdk.VirtualThreadPinned enabled in continuous profiling; alert thresholds configured. |
Verified |
| HTTP Client Configuration | Blocking HTTP clients (e.g., Spring RestClient / Apache HttpClient 5) verified for virtual thread compatibility. |
Verified |
Frequently Asked Questions
Does enabling virtual threads automatically speed up CPU-bound tasks?
No. Virtual threads do not make CPU-intensive computations (such as image rendering, cryptographic hashing, matrix multiplication, or heavy machine learning inference) faster. CPU-bound throughput is physically constrained by the number of physical CPU cores. Virtual threads deliver massive throughput improvements exclusively for I/O-bound workloads (such as database queries, network API calls, and disk operations) where threads spend significant time waiting for external responses.
Should I pool virtual threads using ThreadPoolExecutor or Apache Commons Pool?
No. Never pool virtual threads. Thread pooling is a technique invented to amortize the expensive creation and memory overhead of OS platform threads. Virtual threads are cheap, disposable, user-mode objects designed to be created per task and discarded immediately after completion. Pooling virtual threads adds synchronization overhead, introduces memory retention risks, and restricts the runtime scheduler.
How does Spring Boot 4 handle virtual threads under the hood?
When spring.threads.virtual.enabled=true is set in application.properties, Spring Boot 4 configures Tomcat or Jetty to dispatch each HTTP request on an unbounded virtual thread executor created via Executors.newVirtualThreadPerTaskExecutor(). Furthermore, Spring MVC’s asynchronous execution, @Async task handling, and @Scheduled scheduling engines are automatically rewired to use virtual threads.
What is carrier thread pinning, and how do I detect it in production?
Carrier thread pinning occurs when a virtual thread blocks inside a synchronized block/method or across a native JNI call. Because the monitor attaches to the native OS thread, the virtual thread cannot unmount. The carrier OS thread remains blocked and unable to run other virtual threads. Pinning can be diagnosed in development by running with -Djdk.tracePinnedThreads=full and monitored in production using JDK Flight Recorder (JFR) event jdk.VirtualThreadPinned.
When should I still choose Spring WebFlux over Spring MVC with Virtual Threads?
Spring MVC with Virtual Threads is now the recommended default for the vast majority of enterprise web applications, offering high scalability with simple imperative code. However, Spring WebFlux remains valuable in specialized scenarios: when building continuous streaming architectures (Server-Sent Events or WebSockets with fine-grained backpressure), when integrating deeply with fully reactive driver ecosystems, or when operating in ultra-low-memory edge environments where every kilobyte counts.